 WireGaugeCalc
143 Electrical Fire Statistics October 2026
On this page
- How Many Electrical Fires Start in US Homes Each Year?
- How Deadly and Costly Are Home Electrical Fires?
- Where in the Home Do Electrical Fires Start and What Burns First?
- Which Wiring and Equipment Cause the Most Home Electrical Fires?
- What Fails in an Electrical Fire: Arcing, Shorts or Worn Insulation?
- When Do Home Electrical Fires Happen, and When Do They Kill?
- How Much Does the Age of a Home Matter?
- Can Arc-Fault Protection Cut Home Electrical Fires?
- Do Non-Home Buildings Show the Same Pattern?
- What Do State Fire Marshals Report?
- Methodology and Sources
- Sources
- Glossary
Electrical fire statistics depend on who is counting. NFPA, USFA and CPSC each draw the line in a different place, so the same year can produce totals that differ by a factor of two or more. This page reports each number the way its source states it, with the source named and dated.
It covers fires caused by electrical failure or malfunction in US homes and other buildings: how many, how deadly, where they start, which wiring and equipment is involved, and what the data says about old homes and arc-fault protection. Appliance fires, lithium-ion fires, apartment fires and the all-causes ranking of house fires sit on other pages, such as house fire causes. The page was updated in October 2026 and is refreshed monthly.
Use it as a reference, not as a code check. A statistic here does not show that any product, wiring method or inspection meets a local code. Check the code year your jurisdiction has adopted and ask the local authority.
Key Takeaways
- NFPA counts an average of 46,652 home electrical structure fires a year from 2020 to 2024 (NFPA, May 2026).
- Home electrical fires are about 13% of all home structure fires (NFPA, May 2026).
- They cause about 18% of home structure fire deaths (NFPA, May 2026).
- USFA estimates 26,400 residential building electrical malfunction fires in 2024 (USFA, Sep 2026).
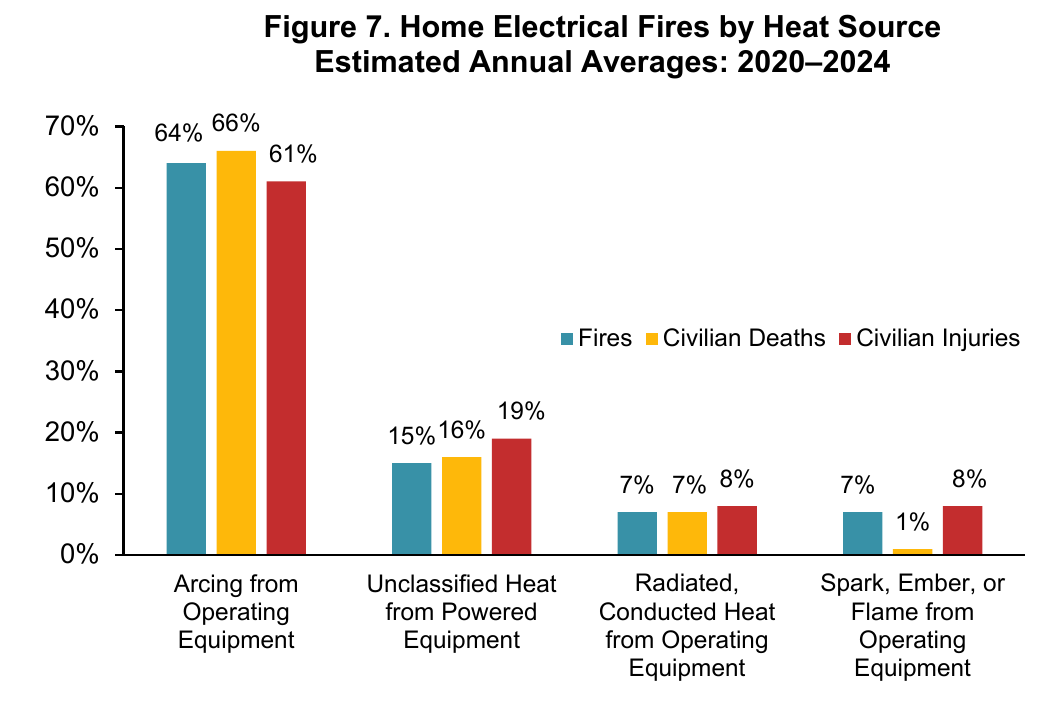
- Arcing from operating equipment was the heat source in 64% of home electrical fires (NFPA, May 2026).
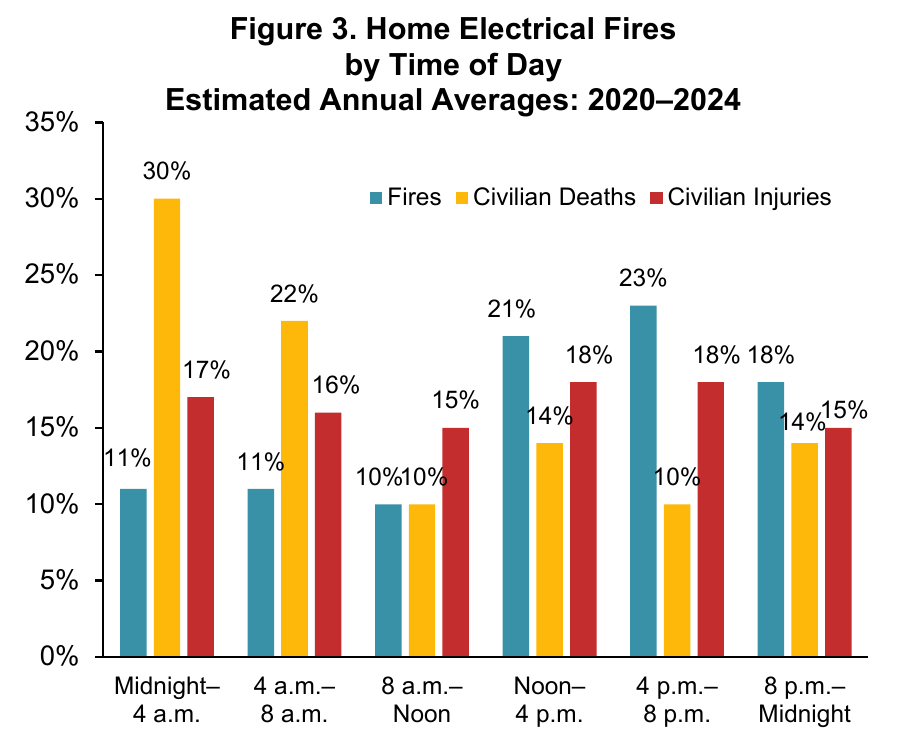
- Midnight to 8 a.m. brings 22% of the fires but 52% of the deaths (NFPA, May 2026).
- Fires that spread beyond the room of origin are 21% of the total but 58% of the deaths (NFPA, May 2026).
- Electrical fires cause over twice the dollar loss per fire: $27,500 against $12,510 (USFA, Dec 2018).
- Installed wiring was involved in 8,100 residential fires a year from 2020 to 2022 (CPSC, Apr 2026).
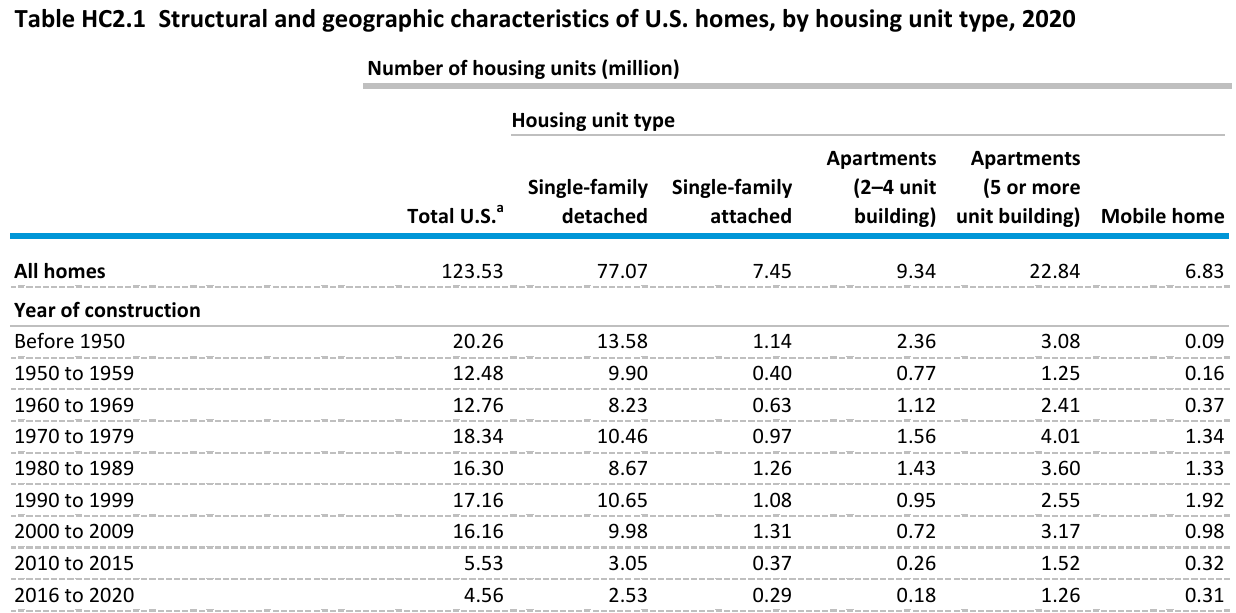
- 20.26 million US homes were built before 1950 (EIA, Mar 2023).
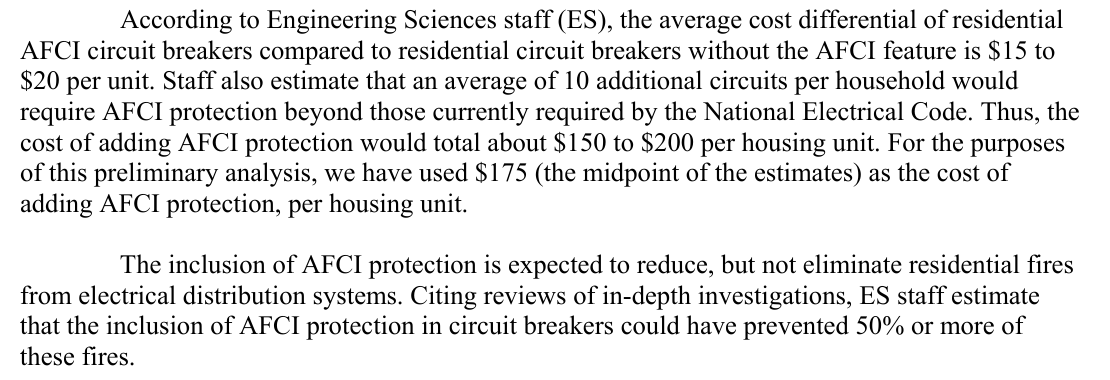
- CPSC staff estimated that AFCI protection could have prevented 50% or more of electrical distribution fires (CPSC, Mar 2003).
- Electrical malfunction caused $697.4 million of nonresidential building fire loss in 2024, the largest of any cause (USFA, Sep 2026).
- Smoke alarms were present in only 51% of electrical fires in occupied homes (USFA, Dec 2018).
- In 2024 electrical fires injured 31 Massachusetts civilians, more than any other cause, for the first time in decades (Massachusetts DFS, Dec 2024).
How Many Electrical Fires Start in US Homes Each Year?
Pick the count that matches your question, because each agency answers a different one. NFPA counts the widest set of fires. USFA counts fires whose cause was an electrical malfunction. CPSC counts fires tied to a type of equipment.
How many home electrical fires does NFPA estimate?
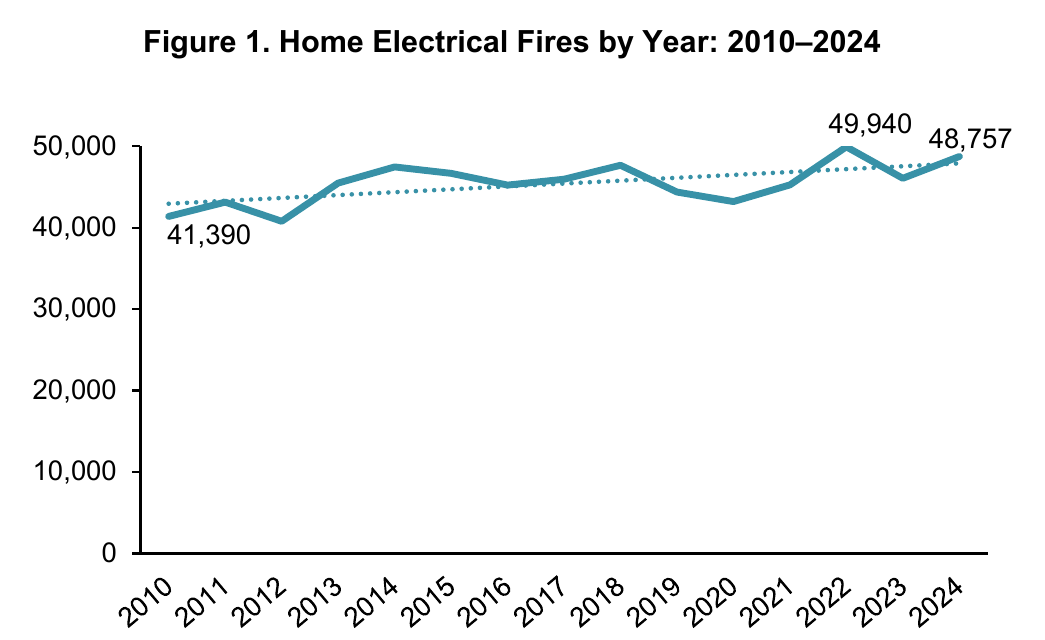
NFPA estimates that home electrical fires rose from 41,390 in 2010 to 48,757 in 2024 (NFPA, May 2026). NFPA counts a fire if an electrical failure contributed to ignition, or if electrical distribution, lighting or power transfer equipment was involved in ignition.
- The peak was 49,940 fires in 2022 (NFPA, May 2026).
How many residential electrical fires does USFA estimate?
USFA estimates that residential building electrical malfunction fires rose 5% from 2015 to 2024 (USFA, Sep 2026). Its figure covers fires coded to an electrical malfunction cause, so it is lower than NFPA’s.
- The 10-year low was 23,400 fires in 2020 (USFA, Sep 2026).
- The 2022 estimate was 26,100 fires (USFA, Sep 2026).
- An earlier USFA report put the 2009 to 2011 average at 25,900 fires a year (USFA, Mar 2014).
- The 2014 to 2016 average was 24,000 fires a year (USFA, Dec 2018).
- In 2014 to 2016, electrical fires were 6% of all residential building fires (USFA, Dec 2018).
How many residential electrical fires does CPSC estimate?
CPSC attributes an average of 18,100 residential fires a year to electrical distribution equipment, such as installed wiring and lighting, from 2020 to 2022 (CPSC, Apr 2026).
- That is 5.0% of all residential fires in the period (CPSC, Apr 2026).
- Counting all electrically powered equipment, including heaters and cooking equipment, CPSC’s total is 56,900 fires a year (CPSC, Apr 2026).
- CPSC’s earlier series averaged 41,500 fires a year involving residential electrical distribution systems from 1990 to 1998 (CPSC, Mar 2003). The two series come from different reports and do not measure a trend on their own.
How Deadly and Costly Are Home Electrical Fires?
Electrical fires are not the most common home fire, but they are among the most expensive, and the deaths do not fall in a straight line. The death count swings from year to year because a few large fires move the estimate.
How many people die in home electrical fires?
NFPA estimates an average of 527 civilian deaths a year from home electrical structure fires in 2020 to 2024 (NFPA, May 2026).
- NFPA’s yearly estimate peaked at 668 deaths in 2023 (NFPA, May 2026).
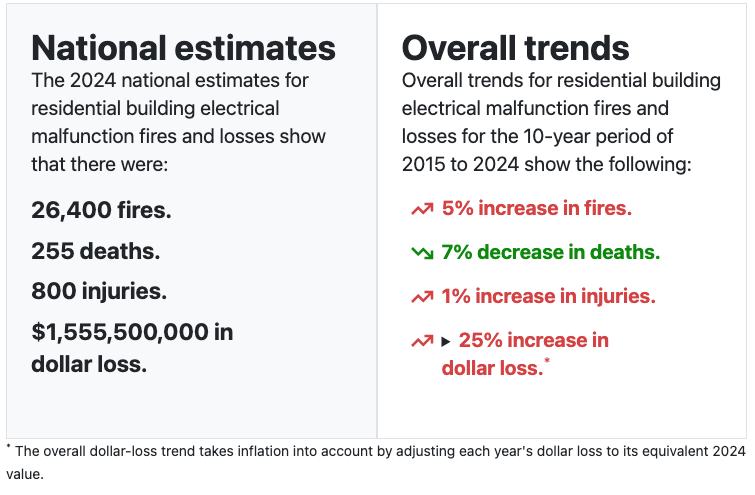
- USFA’s narrower count was 255 deaths in 2024 (USFA, Sep 2026).
- USFA’s low in the 10-year series was 185 deaths in 2022 (USFA, Sep 2026).
- CPSC’s equipment-based estimate is 160 deaths a year in 2020 to 2022, or 6.4% of residential fire deaths (CPSC, Apr 2026).
How many people are injured?
NFPA estimates 1,580 civilian injuries a year from home electrical structure fires in 2020 to 2024 (NFPA, May 2026).
- USFA’s 2024 estimate was 800 injuries (USFA, Sep 2026).
- CPSC’s estimate for electrical distribution equipment is 670 injuries a year, or 6.5% of residential fire injuries (CPSC, Apr 2026).
What do home electrical fires cost?
NFPA estimates $2.4 billion a year in direct property damage from home electrical structure fires in 2020 to 2024 (NFPA, May 2026).
- USFA estimated $1,555,500,000 in 2024 residential electrical malfunction losses (USFA, Sep 2026).
- After adjusting for inflation, USFA’s dollar loss rose 25% from 2015 to 2024 (USFA, Sep 2026).
- Electrical malfunction ranked second among residential fire causes for dollar loss in 2024 (USFA, Sep 2026).
- CPSC puts electrical distribution equipment at $696.9 million a year in 2020 to 2022 (CPSC, Apr 2026).
Are electrical fires worse than other home fires once they start?
Yes, per fire, USFA found that they kill and injure more and cost more. Electrical fires caused 6.3 deaths per 1,000 fires, against 3.4 for nonelectrical fires (USFA, Dec 2018).
- Injuries ran at 26.6 per 1,000 electrical fires against 22.8 for nonelectrical fires (USFA, Dec 2018).
- USFA suggests the gap may come from the difficulty of detecting and locating electrical fires that are hidden inside walls.
Where in the Home Do Electrical Fires Start and What Burns First?
Kitchens start the most fires, but bedrooms and living rooms are where the deaths concentrate. The first thing to burn is usually the wire insulation.
Which rooms are most likely to see an electrical fire?
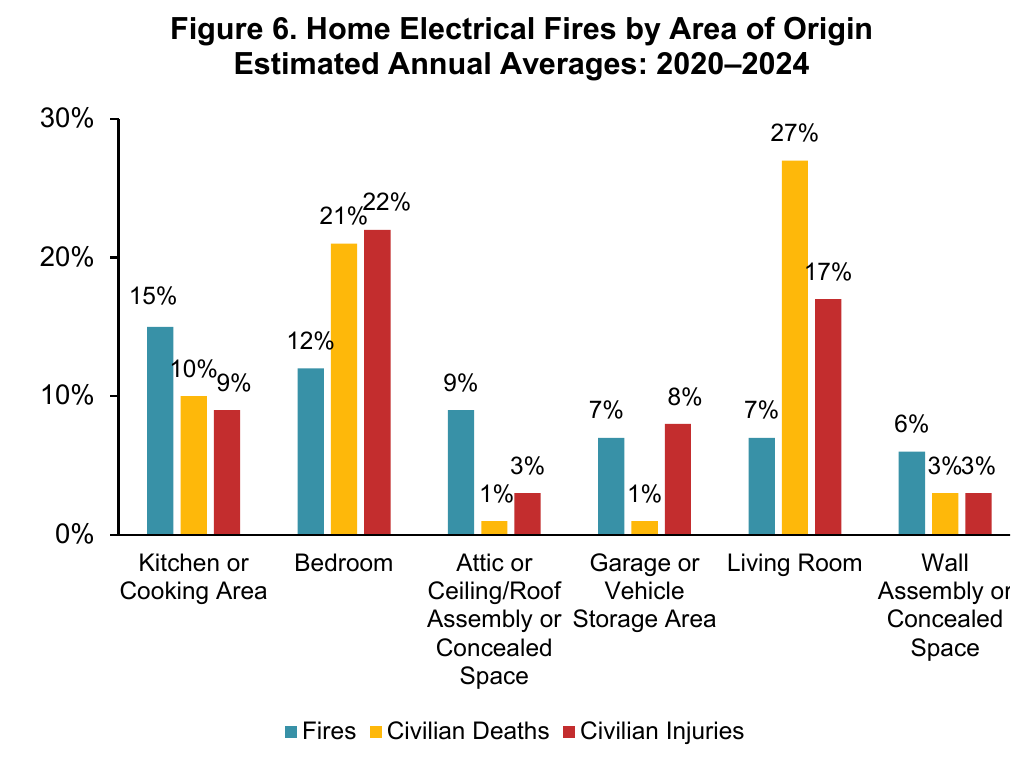
NFPA found that 15% of home electrical fires start in a kitchen or cooking area (NFPA, May 2026).
- Bedrooms account for 12% of the fires (NFPA, May 2026).
- An attic, roof assembly or ceiling concealed space accounts for 9% (NFPA, May 2026).
- Garages and vehicle storage areas are 7% of the fires but 14% of direct property damage (NFPA, May 2026).
Which rooms are deadliest?
Fires that start in a bedroom account for 21% of the deaths (NFPA, May 2026).
- Living rooms are 7% of the fires but 27% of the deaths (NFPA, May 2026).
- In USFA’s 2014 to 2016 data, bedrooms were the most common origin at 15% (USFA, Dec 2018).
How common are hidden fires in walls and attics?
Hidden spaces are a large part of the problem. In USFA’s 2014 to 2016 data, attics and vacant crawl spaces were 13% of electrical fire origins (USFA, Dec 2018).
- Wall assemblies and concealed wall spaces were 9% (USFA, Dec 2018).
- Only 17% of electrical fires stayed on the object where they started, against 64% of nonelectrical fires (USFA, Dec 2018).
What catches fire first?
Electrical wire or cable insulation was the first item ignited in 36% of home electrical fires (NFPA, May 2026).
- Structural components or finishes were first ignited in 33% (NFPA, May 2026).
- Wood or paper was the first material ignited in 38% of fires and plastics in 24% (NFPA, May 2026).
- USFA’s 2014 to 2016 data had structural members or framing as the first item in 18% of fires (USFA, Dec 2018).
Which Wiring and Equipment Cause the Most Home Electrical Fires?
Fixed wiring is involved in more fires than any cord or lamp, and cords and plugs still cost lives. If you size circuits, this is the part of the record that bears on your work.
Which parts of the electrical system are involved?
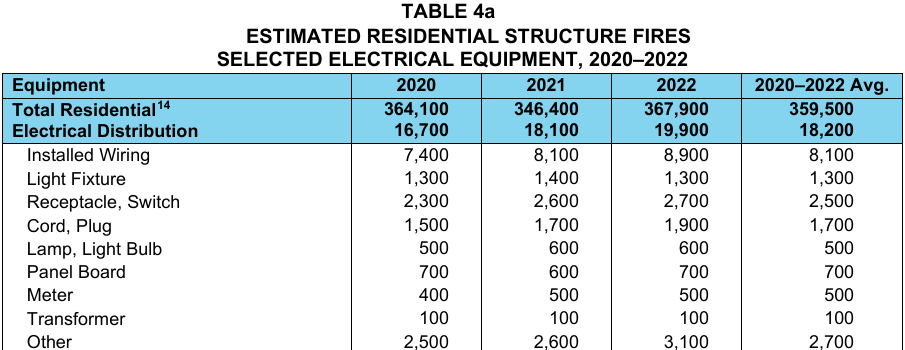
Installed wiring caused an average of $296.2 million in property loss a year in 2020 to 2022 and 60 deaths (CPSC, Apr 2026).
- Receptacles and switches were involved in 2,500 fires a year (CPSC, Apr 2026).
- Cords and plugs were involved in 1,700 fires a year (CPSC, Apr 2026).
- Those cord and plug fires killed 40 people a year and injured 140 (CPSC, Apr 2026).
- Light fixtures were involved in 1,300 fires a year (CPSC, Apr 2026).
- Lamps and light bulbs were involved in 500 fires a year (CPSC, Apr 2026).
- Panel boards were involved in 700 fires and meters in 500 (CPSC, Apr 2026).
Which equipment does USFA flag?
In USFA’s 2014 to 2016 data, “other electrical wiring” was the equipment involved in 31% of residential electrical fires (USFA, Dec 2018).
- Outlets and receptacles were involved in 12% (USFA, Dec 2018).
- Electrical branch circuits were involved in 8% (USFA, Dec 2018).
- Extension cords were involved in 5% and panel or fuse boards in 4% (USFA, Dec 2018).
How does NFPA split the equipment?
NFPA says electrical distribution, lighting and power transfer equipment was involved in 47% of home electrical fires and 60% of the deaths (NFPA, May 2026).
- Heating, ventilating and air conditioning equipment was involved in 9% (NFPA, May 2026).
- No equipment was reported in 32% of the fires (NFPA, May 2026).
Overloaded or undersized circuits are one way a wiring fire starts. The circuit ampacity calculator shows what a given conductor and breaker can carry under the rules of the code year you use.
What Fails in an Electrical Fire: Arcing, Shorts or Worn Insulation?
Mostly an arc. Sources do not agree on every split, but they agree that the cause is usually a failure in the system and not the way someone used it.
How often is the cause an electrical failure?
NFPA found that 77% of home electrical fires had an electrical failure or malfunction as a factor in ignition (NFPA, May 2026).
- Design, manufacturing or installation deficiency was a factor in 1% (NFPA, May 2026).
- Operational deficiency was a factor in 13% of the deaths (NFPA, May 2026).
- Mechanical failure was a factor in 9% of the deaths (NFPA, May 2026).
- In USFA’s 2014 to 2016 data, electrical failure or malfunction was a factor in 88% of fires where a factor was recorded (USFA, Dec 2018).
Which kinds of arc start the fires?
NFPA attributes 17% of home electrical fires to an unspecified short-circuit arc (NFPA, May 2026).
- A short-circuit arc from defective or worn insulation accounts for 6% (NFPA, May 2026).
- An arc from a faulty contact or broken conductor accounts for 3% (NFPA, May 2026).
- USFA found that 23% of fires in 2014 to 2016 were an unspecified short-circuit arc (USFA, Dec 2018).
- USFA found that 11% were a short-circuit arc from defective or worn insulation (USFA, Dec 2018).
Is the pattern the same outside the home?
Nearly half (46%) of non-home electrical failure fires involve some form of arcing (NFPA, Jun 2019).
- Short circuits from defective and worn insulation caused 12% of civilian non-home fire deaths (NFPA, Jun 2019).
When Do Home Electrical Fires Happen, and When Do They Kill?
They peak in winter and in the early evening, and they kill in the dead of night. The hours that carry the most fires are not the hours that carry the most deaths.
Which months are worst?
January, February and December hold 28% of home electrical fires (NFPA, May 2026).
- Those three months hold 39% of the deaths (NFPA, May 2026).
- July is the next busiest month, at 9% of fires (NFPA, May 2026).
- In USFA’s 2014 to 2016 data, January had 12% of fires (USFA, Dec 2018).
- September was the lowest month at 6% (USFA, Dec 2018).
Which hours are deadliest?
Midnight to 4 a.m. holds 30% of the deaths (NFPA, May 2026).
- The same four hours hold only 11% of the fires (NFPA, May 2026).
- Noon to 8 p.m. holds 44% of the fires (NFPA, May 2026).
- Those same hours hold 24% of the deaths (NFPA, May 2026).
Did smoke alarms warn people?
In 24% of electrical fires in occupied homes there was no smoke alarm at all (USFA, Dec 2018).
- In another 25%, firefighters could not tell whether an alarm was present (USFA, Dec 2018).
- In 7% of these fires an alarm was present but failed to operate (USFA, Dec 2018).
- In 11% the fire was too small to set off an alarm that was present (USFA, Dec 2018).
- Automatic extinguishing systems were present in only 3% of electrical fires in occupied homes (USFA, Dec 2018).
How Much Does the Age of a Home Matter?
Older homes are a large share of the housing stock, and government studies have tied electrical fires to older housing. The evidence is dated and partly small-sample, and this page says so where it applies.
How old is the US housing stock?
EIA counts 123.53 million US homes in its 2020 survey (EIA, Mar 2023).
- 12.48 million were built in the 1950s (EIA, Mar 2023).
- 12.76 million were built in the 1960s (EIA, Mar 2023).
- 18.34 million were built in the 1970s (EIA, Mar 2023).
- The median age of owned homes was 41 years in the 2021 American Housing Survey (U.S. Census Bureau, Oct 2023).
- About 17% of homes were older homes built before 1950 (U.S. Census Bureau, Oct 2023).
Do electrical fires cluster in older homes?
A 1990 CPSC study found that 85% of residential electrical distribution fires involved housing more than 20 years old (CPSC, Mar 2003). CPSC notes that the study covered 149 investigated fires in 16 cities and is not a statistically representative sample.
- Housing units over 20 years old were 71% of the stock in 1990 to 1998 (CPSC, Mar 2003).
- One- and two-family homes had 83% of electrical fires in 2014 to 2016 (USFA, Dec 2018).
- Those homes had 60% of nonelectrical fires (USFA, Dec 2018).
- Multifamily buildings had 12% of electrical fires against 33% of nonelectrical fires (USFA, Dec 2018).
What about aluminum wiring?
CPSC estimated in 2003 that 2 million homes were built with aluminum wire between 1965 and 1973 (CPSC, May 2003). The figure comes from a press release and is an estimate of how many homes were built, not how many still have it.
Can Arc-Fault Protection Cut Home Electrical Fires?
CPSC staff thought so, and the arc is the main heat source in the fires. But the best government estimate is old, and no figure on this page measures how many fires AFCIs have prevented. Check the code year your jurisdiction has adopted before you rely on any requirement.
What did CPSC estimate for cost and benefit?
CPSC staff put the extra cost of an AFCI breaker at $15 to $20 per unit (CPSC, Mar 2003).
- They estimated 10 additional circuits per household beyond what the code then required (CPSC, Mar 2003).
- That put the cost of adding AFCI protection at $150 to $200 per housing unit (CPSC, Mar 2003).
- At a 3% discount rate, AFCIs would need about 41% effectiveness to pay back at construction, assuming a 40-year life (CPSC, Mar 2003).
- Installed after 20 years, a 26% effectiveness rate would match the cost (CPSC, Mar 2003).
- Industry sources cited by CPSC put major electrical renovations at about 1.9 million housing units each year (CPSC, Mar 2003).
What was the fire problem before AFCIs?
CPSC reported an average of 326 deaths a year in residential electrical distribution fires from 1990 to 1998 (CPSC, Mar 2003).
- Injuries averaged 1,481 a year (CPSC, Mar 2003).
- Property loss averaged $646 million a year (CPSC, Mar 2003).
- With deaths valued at $5 million each, CPSC put the total yearly cost to society at about $2.360 billion (CPSC, Mar 2003).
Which code editions do states enforce?
The adopted edition of the National Electrical Code decides what a new home must have, and it varies by state. IAEI’s state table lists 21 jurisdictions on the 2023 edition (IAEI, Oct 2026).
- 16 states are listed on the 2020 edition (IAEI, Oct 2026).
- 3 states are listed on the 2026 edition (IAEI, Oct 2026).
- Two states, Nevada and Tennessee, are listed on the 2017 edition (IAEI, Oct 2026).
An installer sizing a breaker for a branch circuit still has to check the edition and local amendments. The breaker size calculator is an aid for the sizing step only.
Do Non-Home Buildings Show the Same Pattern?
Mostly yes. Wiring leads again, deaths are far fewer than in homes, and the dollar losses are large.
How big is the non-home problem?
NFPA estimated 16,540 non-home fires a year involving an electrical failure or malfunction in 2012 to 2016 (NFPA, Jun 2019).
- They caused an average of 23 civilian deaths a year (NFPA, Jun 2019).
- They caused an average of 200 civilian injuries a year (NFPA, Jun 2019).
- They caused $637 million a year in direct property damage (NFPA, Jun 2019).
- Non-home residential properties, such as hotels and dormitories, had 18% of the fires but 82% of the deaths (NFPA, Jun 2019).
What equipment is involved?
Wiring and related equipment was involved in 36% of non-home electrical failure fires (NFPA, Jun 2019).
- Lamps, bulbs and lighting were involved in 10% (NFPA, Jun 2019).
- Electrical failure or malfunction was a factor in 12% of all non-home fires (NFPA, Jun 2019).
What does USFA add for nonresidential buildings?
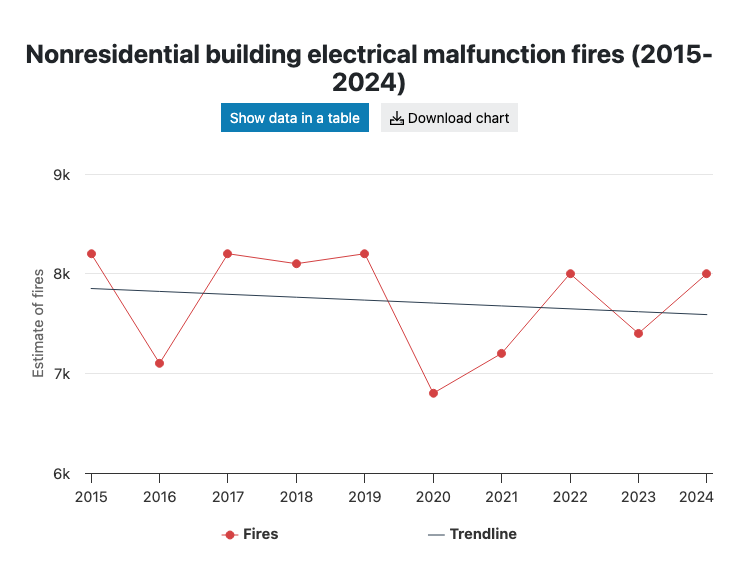
USFA estimates 8,000 nonresidential building electrical malfunction fires in 2024 (USFA, Sep 2026).
- A $173 million pier fire in California pushed up the 2024 dollar loss (USFA, Sep 2026).
- In 2017 to 2019, electrical malfunctions caused 8% of all nonresidential building fires (USFA, Dec 2021).
- They caused 14% of the larger, nonconfined fires (USFA, Dec 2021).
- They caused 19% of nonconfined fires in assembly places (USFA, Dec 2021).
What Do State Fire Marshals Report?
State records are the best way to test the national picture against real incident counts. They show the same lean toward losses and injuries.
What did Massachusetts report?
Massachusetts fire departments reported 638 structure fires caused by electrical events in 2024 (Massachusetts DFS, Dec 2024).
- Those fires killed 8 civilians (Massachusetts DFS, Dec 2024).
- They caused 36 fire service injuries (Massachusetts DFS, Dec 2024).
- They caused an estimated $45.5 million in dollar loss, or 15% of the state’s total (Massachusetts DFS, Dec 2024).
- More than three-quarters took place in residential occupancies (Massachusetts DFS, Dec 2024).
- In 2023, electrical fires caused 19% of residential civilian fire deaths (Massachusetts DFS, Dec 2023).
What did Maine and Minnesota report?
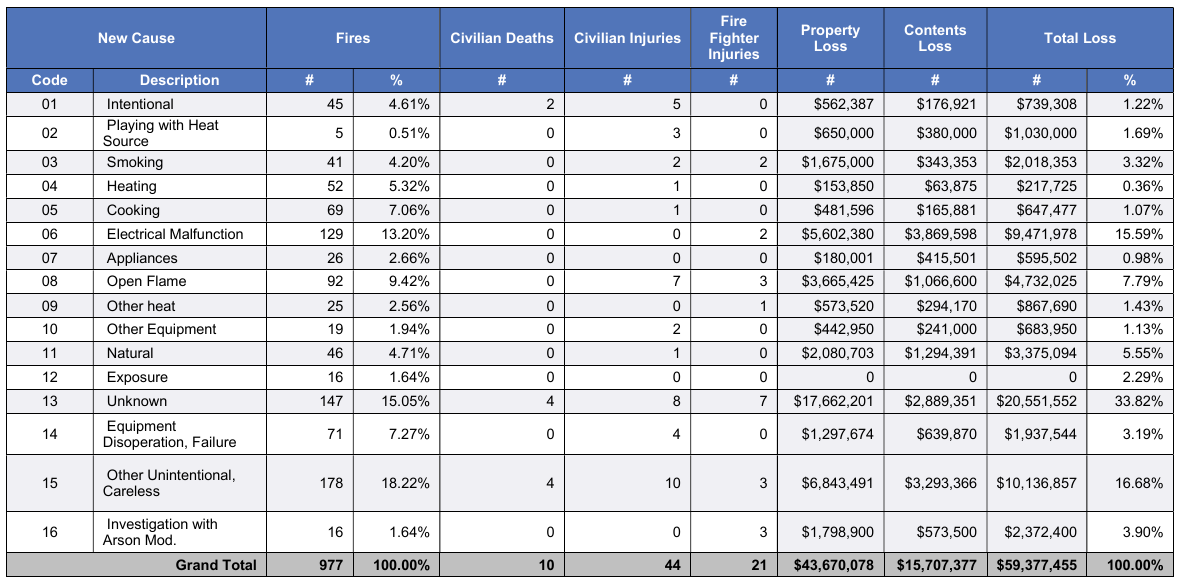
Maine recorded 129 structure fires from electrical malfunction in 2024, or 13.20% of all structure fires (Maine State Fire Marshal, Dec 2025).
- Those fires caused $9,471,978 in total loss, 15.59% of the structure fire total (Maine State Fire Marshal, Dec 2025).
- Minnesota’s State Fire Marshal reported that electrical malfunction passed heating as the second-most known cause of residential fires for the second year in a row in 2024 (Minnesota State Fire Marshal, Dec 2024).
Methodology and Sources
Every number comes from the agency that produced it: NFPA, the U.S. Fire Administration, the Consumer Product Safety Commission, the U.S. Energy Information Administration, the U.S. Census Bureau, the International Association of Electrical Inspectors, and the state fire marshal offices of Massachusetts, Maine and Minnesota. No roundup or reseller is cited. Where a report shows no publication month, the date shown is the last month of its data year. USFA data pages carry their own last-reviewed date. The Maine date is the creation date of the PDF. Undated NFPA web pages that repeat the May 2026 report carry that date. The four national agencies define an electrical fire differently, so the totals are not meant to be added or compared line by line. Dated items, such as the 2003 CPSC memo and the 2019 NFPA non-home report, are the latest available on those points and are labeled as such. This page is checked and refreshed monthly.
Sources
- NFPA, Home Electrical Fires (May 2026)
- NFPA, Home Electrical Fires: Supporting Tables (May 2026)
- NFPA, Electrical Safety in the Home
- NFPA, Non-Home Electrical Fires (Jun 2019)
- USFA, Residential Building Electrical Malfunction Fire Trends (2015-2024)
- USFA, Nonresidential Building Electrical Malfunction Fire Trends (2015-2024)
- USFA, Residential Building Fire Dollar-Loss Causes (2015-2024)
- USFA, Nonresidential Building Fire Dollar-Loss Causes (2015-2024)
- USFA, Residential Building Electrical Fires (2014-2016), Dec 2018
- USFA, Residential Building Electrical Fires (2009-2011), Mar 2014
- USFA, Nonresidential Building Fires (2017-2019), Dec 2021
- CPSC, 2020-2022 Residential Fire Loss Estimates (Apr 2026)
- CPSC, Economic Considerations: AFCI Replacements (Mar 2003)
- CPSC, Aluminum Wiring Fix Still Available (May 2003)
- EIA, Residential Energy Consumption Survey 2020, Table HC2.1
- U.S. Census Bureau, Cost of Improving and Maintaining Older Homes Higher for New Owners (Oct 2023)
- IAEI, Code Adoption by State
- Massachusetts Department of Fire Services, 2024 MFIRS Annual Report
- Massachusetts Department of Fire Services, 2023 MFIRS Executive Summary
- Maine State Fire Marshal, 2024 Annual Operations and State Incident Report
- Minnesota State Fire Marshal, Fire in Minnesota 2024
Glossary
- AFCI: arc-fault circuit interrupter, a breaker or outlet that detects dangerous arcing and cuts power.
- AHJ: authority having jurisdiction, the local body that enforces the adopted code.
- CPSC: U.S. Consumer Product Safety Commission.
- EIA: U.S. Energy Information Administration.
- IAEI: International Association of Electrical Inspectors.
- NEC: the National Electrical Code, NFPA 70, a trademark of NFPA.
- NFIRS: National Fire Incident Reporting System, the USFA database that fire departments report to.
- NFPA: National Fire Protection Association.
- Nonconfined fire: a fire that spread beyond a pot, fireplace or other contained object.
- USFA: U.S. Fire Administration.
Cite this page
Every figure links to the source that published it. Quote one with a link to this page or to the source.
WireGaugeCalc. "143 Electrical Fire Statistics October 2026." WireGaugeCalc, October 2026. https://www.wiregaugecalc.com/statistics/electrical-fire-statistics/ <a href="https://www.wiregaugecalc.com/statistics/electrical-fire-statistics/">Electrical Fire Statistics</a> (WireGaugeCalc, October 2026)