 WireGaugeCalc
111 House Fire Causes Statistics October 2026
On this page
- What are the most common causes of house fires?
- Which causes of house fires kill the most people?
- Which causes of house fires injure the most people and cost the most?
- Why does cooking cause so many fires?
- What do the numbers say about heating equipment fires?
- How do smoking materials, candles and lighters rank among the causes of house fires?
- Where does electrical equipment rank among the causes of house fires?
- How do intentional fires and children playing rank?
- When do home fires start?
- Where do house fires start, and what burns first?
- How do the causes of house fires compare in England and Wales?
- Methodology and Sources
- Glossary
- Sources
House fire causes statistics tell two stories, and most pages blend them. The cause that starts the most fires is not the cause that kills the most people. This page ranks each cause of US home fires by fires, deaths, injuries and property loss, and it shows where the main sources disagree.
Every figure comes from the group that produced it: the National Fire Protection Association (NFPA), the U.S. Fire Administration (USFA), the Consumer Product Safety Commission (CPSC), and for comparison the governments of England and Wales. These groups sort causes in different ways, so the same fire can land in different rows. Each number below names its source and date.
Cooking leads by count. Smoking materials, heating equipment and electrical equipment lead by harm. Read the ranking you need for the decision in front of you: where to put smoke alarms, how to size a circuit, or what to check on a home walkthrough. Rankings describe reported fires only. They do not show the risk in any single home.
Key Takeaways
- Cooking started 49% of reported US home fires in 2019 to 2023, an average of 159,439 fires a year (NFPA, Aug 2025).
- Smoking materials caused 23% of home fire deaths from only 5% of fires (NFPA, Aug 2025).
- Electrical distribution and lighting equipment caused 18% of home fire property damage, the largest share of any cause (NFPA, Aug 2025).
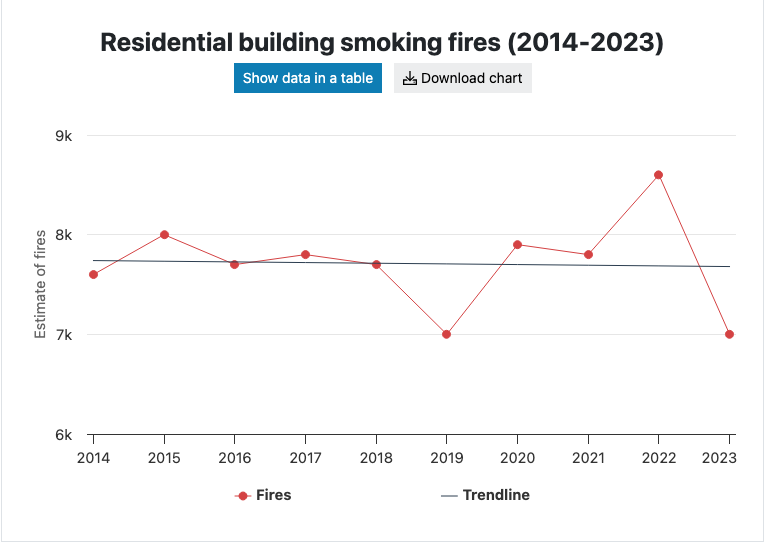
- Cooking started 167,800 US residential building fires in 2023 and caused 125 deaths; smoking started 7,000 fires and caused 255 deaths (USFA, Feb 2025; USFA, Feb 2025).
- Portable heaters were 3% of residential heating fires but 41% of fatal heating fires (USFA, Dec 2021).
- Careless or other unintentional actions led larger (nonconfined) residential fires at 17%, just ahead of electrical malfunction at 16% (USFA, May 2021).
- Fires still under investigation were 12% of home fires but 49% of home fire deaths, so cause rankings leave out some deaths (NFPA, Aug 2025).
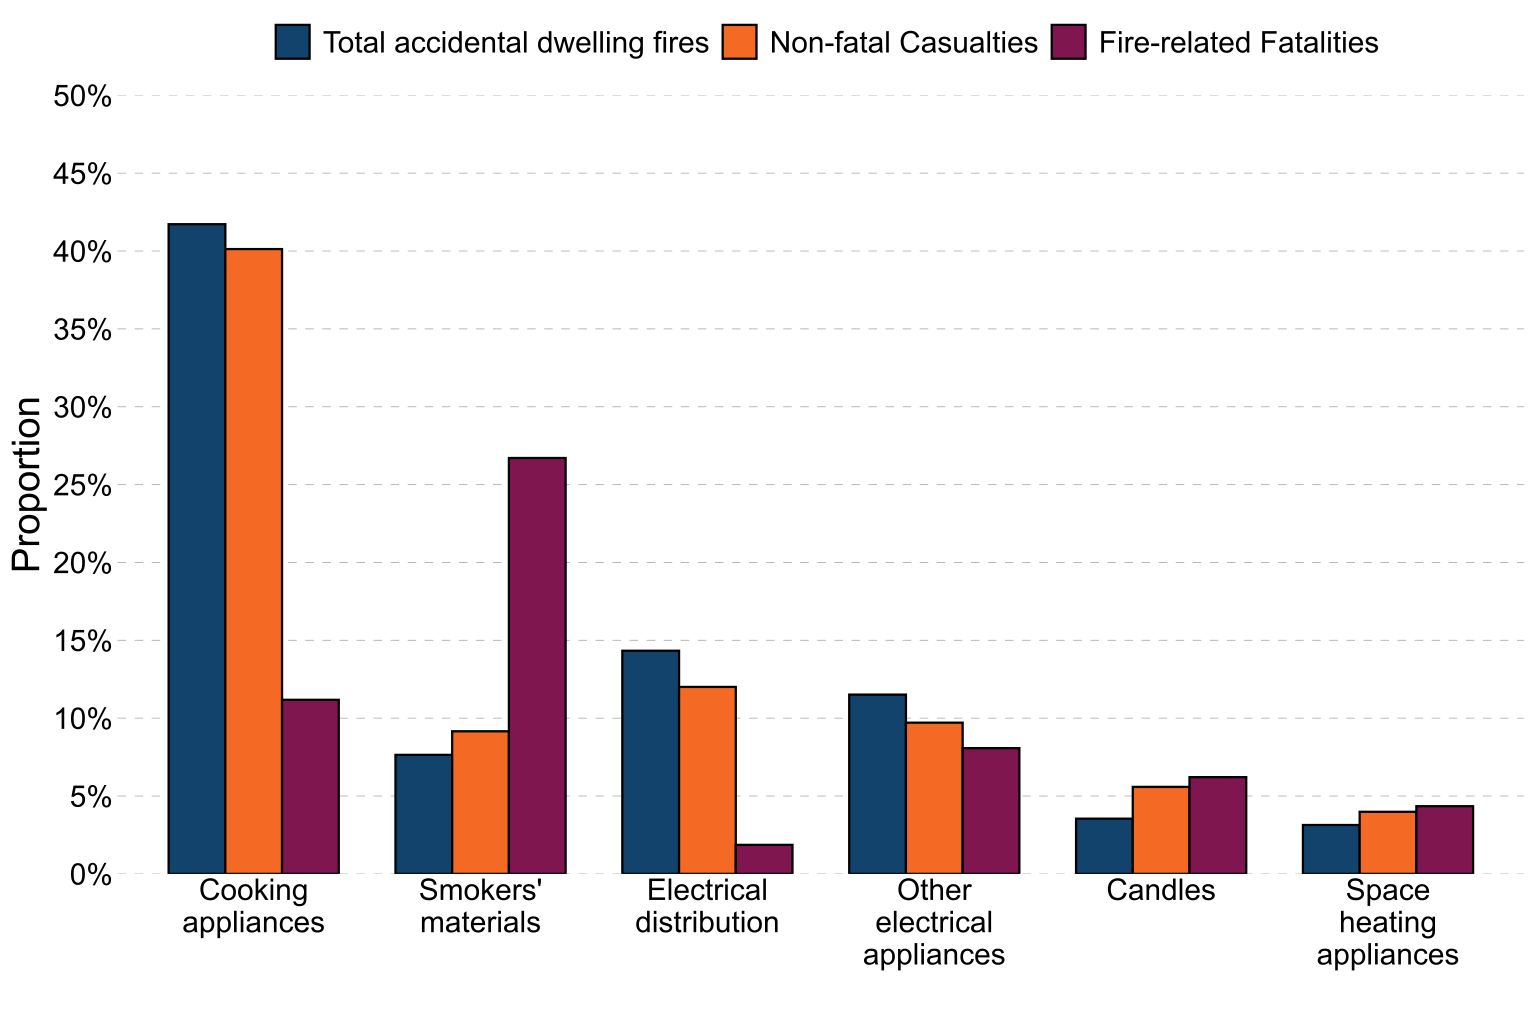
- In England, cooking appliances started 42% of accidental dwelling fires but 11% of the deaths; smoking materials started 7.6% of fires and 27% of the deaths (MHCLG, Aug 2026).
- Homes with electric ranges had 2.4 times the cooking fires per million households of homes with gas ranges (NFPA, Sep 2023).
- Residential fires on Thanksgiving Day ran 2.3 times the daily average for all other days (USFA, Nov 2021).
- Smoking materials were the heat source in an average of 630 residential fire deaths a year in 2018 to 2020, or 25.9% of the total (CPSC, Aug 2023).
- Fires between 11 p.m. and 7 a.m. were 19% of home fires but 48% of home fire deaths (NFPA, Aug 2025).
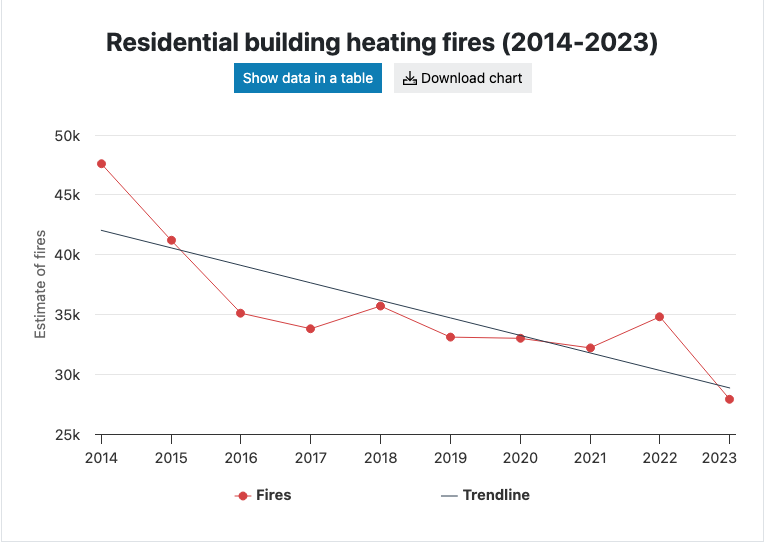
- Other unintentional and careless fires rose 42% from 2014 to 2023 while heating fires fell 31% (USFA, Feb 2025).
What are the most common causes of house fires?
Cooking is the clear leader by count, and the gap is wide. After cooking, the order depends on which agency you read and how it groups causes.
Which causes start the most fires after cooking?
- Heating equipment started an average of 64,958 home fires a year in 2019 to 2023, or 20% of the total (NFPA, Aug 2025).
- Electrical distribution, lighting and power transfer equipment started 31,647 home fires a year in the same period (NFPA, Aug 2025).
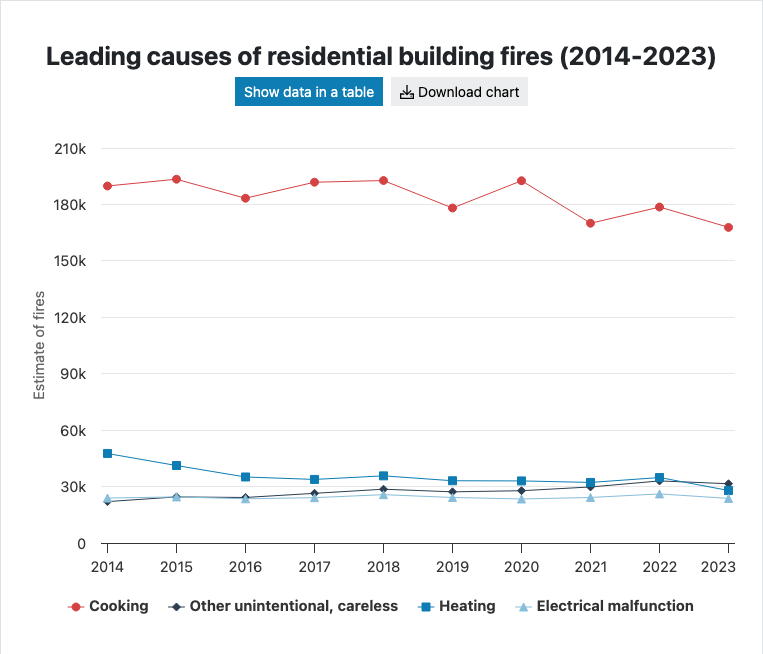
- USFA counted 31,500 other unintentional or careless residential fires in 2023, the second largest group in its ranking (USFA, Feb 2025).
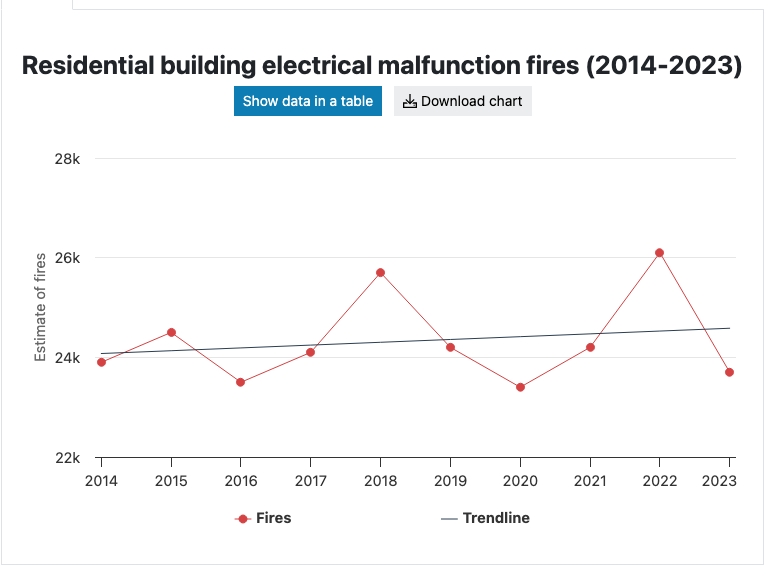
- USFA counted 27,900 heating fires and 23,700 electrical malfunction fires in 2023 (USFA, Feb 2025).
What share of fires does each cause hold?
- Cooking caused 51% of all residential building fires in 2017 to 2019 (USFA, May 2021).
- Heating caused 9%, other unintentional or careless actions 7%, and electrical malfunction 7% in the same period (USFA, May 2021).
- Cooking fires fell 11% and electrical malfunction fires rose 2% over the ten years to 2023 (USFA, Feb 2025).
- Cooking equipment was involved in 164,500 unintentional residential fires a year in 2018 to 2020, or 45.6% of the total (CPSC, Aug 2023).
- Heating and cooling equipment was involved in 39,400 fires a year, or 10.9% (CPSC, Aug 2023).
- Electrical distribution equipment was involved in 17,200 fires a year, or 4.8% (CPSC, Aug 2023).
Why do the agencies disagree on the order?
- By 2020, 52% of residential structure fires in the federal incident system were coded as confined fires, and the equipment involved is rarely recorded for them, so equipment rankings miss much of the cooking problem (CPSC, Aug 2023).
- NFPA could not assign a cause to 31,309 home fires a year (10%) even after investigation, and those fires caused 450 deaths (NFPA, Aug 2025).
Which causes of house fires kill the most people?
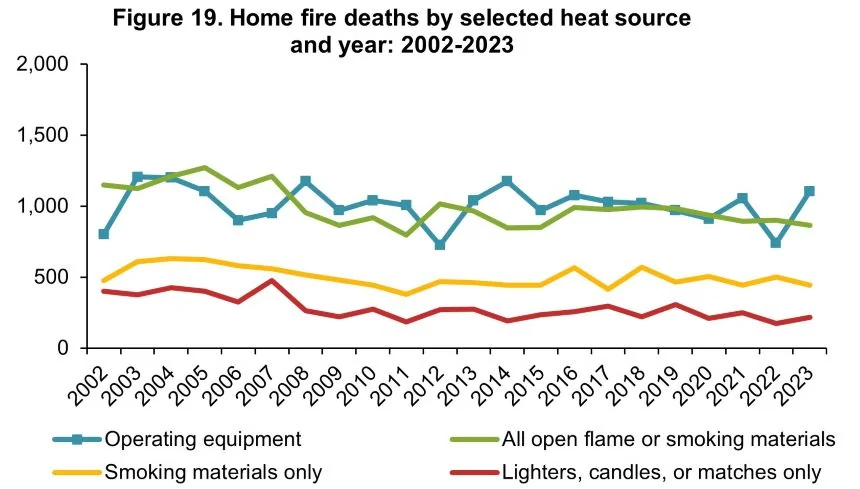
Deaths follow a different order from fires. In NFPA’s data heating, cooking and electrical equipment are nearly tied for deaths, and smoking materials sit alone at the top.
How do NFPA’s death counts rank the causes?
- Heating equipment caused 432 home fire deaths a year in 2019 to 2023 (17%), cooking 428 (16%) and electrical distribution and lighting equipment 425 (16%) (NFPA, Aug 2025).
- Lighters, candles or matches caused 287 deaths a year (11%) (NFPA, Aug 2025).
- Fires started by operating equipment such as ranges, heaters and dryers were 50% of home fires and 37% of deaths, or 960 deaths a year (NFPA, Aug 2025).
What does CPSC’s death ranking show?
- Cooking equipment was linked to 210 unintentional residential fire deaths a year in 2018 to 2020, or 8.7% of the total (CPSC, Aug 2023).
- Heating and cooling equipment was linked to 190 deaths a year, or 7.6% (CPSC, Aug 2023).
- Electrical distribution equipment was linked to 140 deaths a year, or 5.6% (CPSC, Aug 2023).
How does USFA’s 2023 death count compare?
- Electrical malfunction fires caused 305 residential building deaths in 2023, more than the totals USFA reports for cooking, heating, smoking or intentional fires (USFA, Feb 2025).
- Intentional fires caused 290 deaths in 2023 (USFA, Feb 2025).
- Heating fires caused 115 deaths in 2023 (USFA, Feb 2025).
Which causes of house fires injure the most people and cost the most?
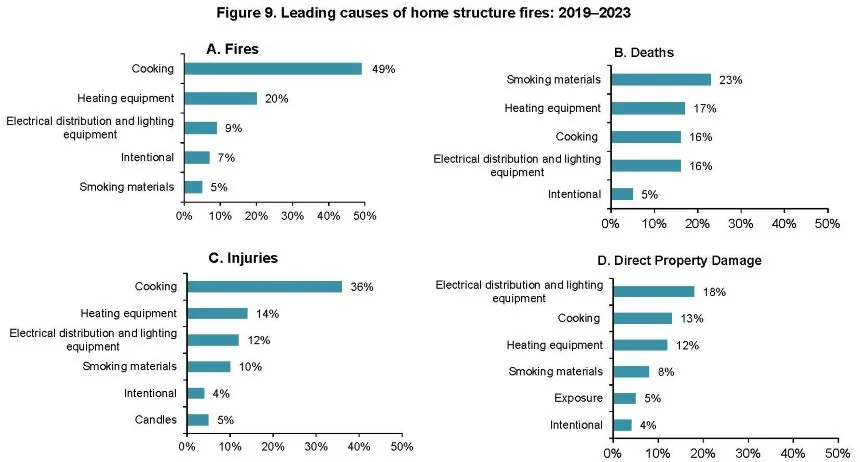
Cooking dominates injuries, and electrical equipment dominates dollar loss. Neither ranking matches the death ranking, so no single list of causes answers every question.
Which causes injure the most people?
- Cooking caused 3,854 home fire injuries a year in 2019 to 2023 (36%), heating equipment 1,527 (14%) and electrical equipment 1,279 (12%) (NFPA, Aug 2025).
- Cooking equipment accounted for 3,140 injuries a year in 2018 to 2020, or 28.1% of the total (CPSC, Aug 2023).
- USFA estimated 2,500 cooking injuries in 2023 (USFA, Feb 2025).
- USFA estimated 800 electrical malfunction injuries in 2023 (USFA, Feb 2025).
Which causes cost the most?
- Cooking caused $1,155 million in direct property damage a year in 2019 to 2023 and heating equipment $1,112 million (NFPA, Aug 2025).
- Fires that spread from a neighboring fire had the highest average property loss per fire of any major cause (NFPA, Aug 2025).
- USFA put electrical malfunction losses at $1.5 billion in 2023 (USFA, Feb 2025).
- USFA put intentional fire losses at $631.1 million in 2023 (USFA, Feb 2025).
- CPSC estimated $610.3 million a year in electrical distribution losses against $606.7 million for cooking equipment, in unadjusted dollars (CPSC, Aug 2023).
Why does cooking cause so many fires?
Cooking leads because it happens in nearly every home, almost every day, and it is often left alone. The stove is rarely the fault. The cook walking away usually is.
How common is cooking in US homes?
- 79% of US households prepared at least one hot meal at home each day in 2020 (EIA, Aug 2022).
- 89% of households had a range, and about 38% cooked with natural gas (EIA, Aug 2022).
What goes wrong in cooking fires?
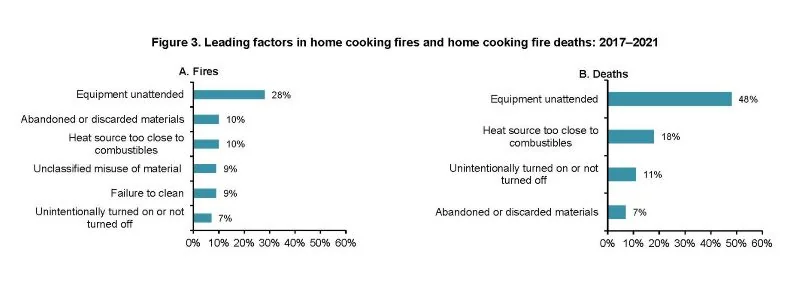
- Unattended equipment was the factor in 28% of home cooking fires and 48% of cooking fire deaths in 2017 to 2021, and a heat source too close to combustibles was behind 18% of the deaths (NFPA, Sep 2023).
- Unattended equipment was the leading factor in 37% of nonconfined cooking fires in 2017 to 2019 (USFA, Jul 2021).
- Oil, fat and grease were the material ignited in 45% of nonconfined cooking fires (USFA, Jul 2021).
- Oil, fat or grease was the first item ignited in 51% of cooking fires that began with cooking materials, and in 53% of the deaths from such fires (NFPA, Sep 2023).
- Clothing was the first item ignited in under 1% of cooking fires but led to 7% of cooking fire deaths (NFPA, Sep 2023).
Which cooking equipment is involved?
- Ranges or cooktops were involved in 53% of home cooking fires, 88% of the deaths and 74% of the injuries (NFPA, Sep 2023).
- Electric ranges were 80% of the ranges in cooking fires, though 64% of households cook with electricity (NFPA, Sep 2023).
- Ranges and ovens were recorded in 14,100 residential fires and 160 deaths a year in 2018 to 2020, with confined fires left out of the equipment detail (CPSC, Aug 2023).
How serious are most cooking fires, and when do they happen?
- 93% of residential cooking fires were small, confined fires in 2017 to 2019 (USFA, Jul 2021).
- Cooking caused 73.5% of Thanksgiving Day residential fires with a known cause (USFA, Nov 2021).
- 54% of Thanksgiving Day residential fires started between 10 a.m. and 5 p.m. (USFA, Nov 2021).
- Fires from 11 p.m. to 7 a.m. were 17% of cooking fires but 19% of cooking fire deaths (NFPA, Sep 2023).
- Residential cooking fire deaths fell 49% from 2014 to 2023 (USFA, Feb 2025).
If you are sizing the circuit for an electric range, the range wire size calculator shows the NEC table behind its result. Check the adopted code year and the local authority before you build.
What do the numbers say about heating equipment fires?
Heating is the second-largest cause of home fires and it is shrinking. But when a space heater or heating stove is the source, the fire is far more likely to kill.
How big is the heating problem?
- US fire departments responded to an average of 37,365 home heating equipment fires a year in 2020 to 2024, or 11% of home fires, causing 417 deaths and 1,260 injuries a year (NFPA, Jan 2026).
- Space heaters and heating stoves were 47% of those fires but 73% of the deaths and 70% of the injuries (NFPA, Jan 2026).
- Heating fires between midnight and 6 a.m. were 13% of the total in 2016 to 2020 but 43% of the deaths (NFPA, Dec 2022).
What do USFA and CPSC add?
- Residential heating fires fell from 200,000 in 1983 to an estimated 41,200 in 2015 (USFA, Dec 2021).
- The heat source was too close to combustibles in 27% of nonconfined residential heating fires in 2017 to 2019 (USFA, Dec 2021).
- Residential heating fires peaked in January at 20% of the yearly total (USFA, Dec 2021).
- Placing the heat source too close to combustible objects was the leading factor in 48% of portable heater fires (USFA, Dec 2021).
- Portable heater fires most often started in bedrooms, at 34% (USFA, Dec 2021).
- Portable heaters and fixed local heaters were each linked to 70 residential fire deaths a year in 2018 to 2020 (CPSC, Aug 2023).
- Fireplaces, chimneys and chimney connectors were involved in 15,800 residential fires a year in the same period (CPSC, Aug 2023).
- 5.8 million US households did not use any space-heating equipment in 2020, mostly in warm regions (EIA, Mar 2023).
How do smoking materials, candles and lighters rank among the causes of house fires?
Smoking materials start few fires and cause many deaths. Candles and lighters follow the same pattern on a smaller scale: a low count of fires with an outsized share of deaths.
How deadly are smoking-material fires?
- Counted by heat source rather than by cause, smoking materials started an average of 22,800 home fires a year in 2019 to 2023 (7%) and caused 25% of the deaths (NFPA, Aug 2025).
- Cigarettes and other tobacco products were the heat source in 10,300 residential fires a year in 2018 to 2020 (CPSC, Aug 2023).
- Smoking-material ignition of upholstered furniture caused 210 deaths a year and of mattresses and bedding 180 (CPSC, Aug 2023).
- Residential smoking fire deaths fell 20% from 2014 to 2023 (USFA, Feb 2025).
- 14.0% of US adults, or 34.1 million people, smoked cigarettes in 2019 (CDC, Nov 2020).
What about candles, lighters and matches?
- Candles started an average of 7,610 home fires and 81 deaths a year in 2014 to 2018 (NFPA, May 2020).
- In 60% of candle fires something that could burn was too close to the candle, and in 16% the candle was unattended or abandoned (NFPA, May 2020).
- 40% of candle fire deaths happened in the bedroom (NFPA, May 2020).
- Lighters, candles and matches together were the heat source in 21,500 home fires a year (7%) and 260 deaths (11%) in 2019 to 2023 (NFPA, Aug 2025).
- CPSC linked candles to 5,500 residential fires, 110 deaths and 560 injuries a year in 2018 to 2020 (CPSC, Aug 2023).
- CPSC linked lighters to 1,400 fires, 60 deaths and 280 injuries a year in the same period (CPSC, Aug 2023).
Where does electrical equipment rank among the causes of house fires?
Electrical distribution and lighting equipment ranks third for fires in NFPA’s data, sits within a few deaths of the leaders, and ranks first for dollar loss. This page shows only where electrical sits in the ranking. The full breakdown is on the electrical fire statistics page.
How does the ranking change with the definition?
- Wiring and related equipment accounted for 3% of all home fires and 5% of home fire deaths, and cords or plugs for 1% of fires and 3% of deaths (NFPA, Aug 2025).
- Under a wider definition that includes any fire where an electrical failure or malfunction contributed, NFPA counted 46,652 home electrical fires a year in 2020 to 2024 (NFPA, May 2026).
- Electrical distribution and lighting equipment was the leading cause of bedroom fires, at 30% (NFPA, Aug 2025).
- USFA’s electrical malfunction fires rose 2% from 2014 to 2023, while deaths fell 19% (USFA, Feb 2025).
- Electrical arcing was the heat source in 17% of nonconfined residential fires in 2017 to 2019 (USFA, May 2021).
- Installed wiring was involved in 7,600 residential fires and 40 deaths a year in 2018 to 2020 (CPSC, Aug 2023).
- Cords and plugs were involved in 1,600 fires and 50 deaths a year in the same period (CPSC, Aug 2023).
- In Wales, electrical distribution was the recorded source in 14% of accidental primary fires in 2024 to 2025 (Welsh Government, Dec 2025).
Extension cords sit in this ranking too. The extension cord calculator shows how load and length change the wire gauge you need.
How do intentional fires and children playing rank?
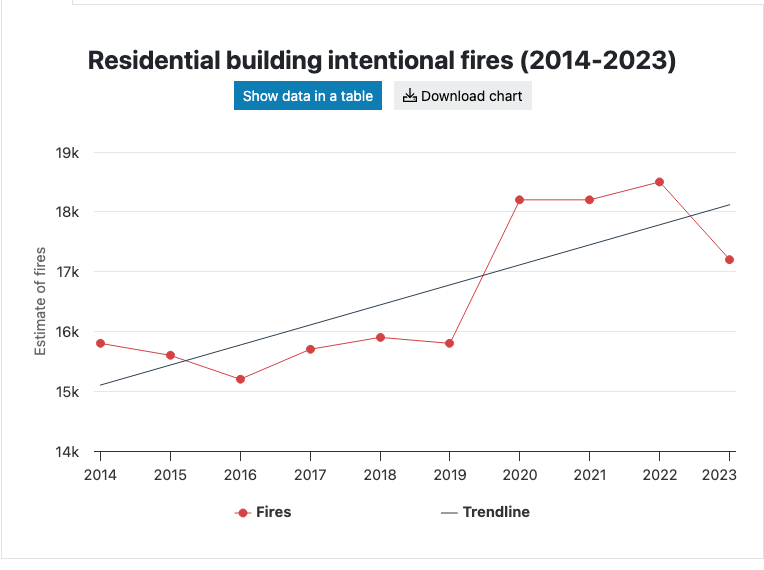
Intentional fires are fewer than heating fires in USFA’s 2023 data but caused more deaths. Children playing with fire is a smaller group, and the child-resistant lighter rule is linked to a large drop.
How do intentional fires behave?
- Fires from midnight to 8 a.m. were about one-fifth of intentional structure fires but caused two in five of the deaths (NFPA, Sep 2021).
- USFA’s intentional residential fires rose 20% from 2014 to 2023 (USFA, Feb 2025).
- England recorded 2,385 deliberate dwelling fires in the year ending March 2026 (MHCLG, Aug 2026).
How many fires do children playing with fire start?
- Playing with a heat source was a factor in 3,025 home fires, 23 deaths and 258 injuries a year in 2019 to 2023 (NFPA, Aug 2025).
- Deaths from children playing with lighters fell from 230 in 1994 to 130 in 1998 after child-resistant lighters were required (CPSC, Nov 2000).
- Residential fires from children playing with lighters fell from 11,100 in 1994 to 6,100 in 1998 (CPSC, Nov 2000).
When do home fires start?
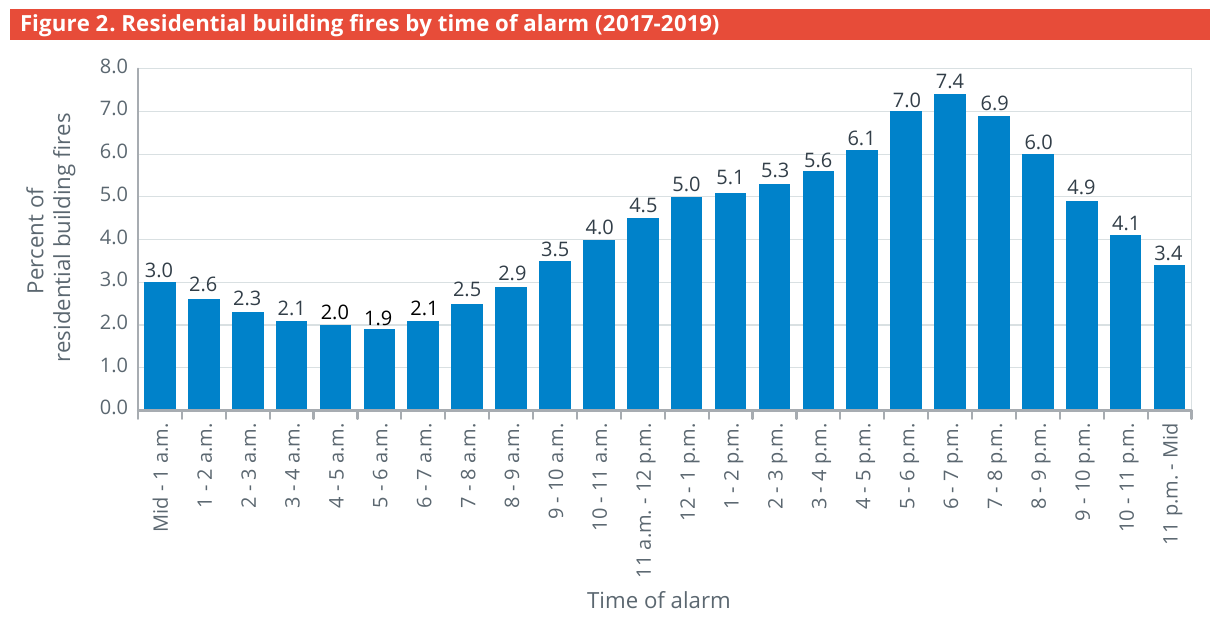
Fires follow the household clock. Most start in the early evening, but the deadliest hours are overnight.
Which hours and months are worst?
- Residential fires peaked in January at 10% of the yearly total (USFA, May 2021).
- 46% of home fires and 53% of home fire deaths happened from November through March (NFPA, Aug 2025).
- The 6 p.m. hour averaged 24,364 home fires and 92 deaths a year, while the 2 a.m. hour averaged 7,382 fires and 185 deaths (NFPA, Aug 2025).
- The four hours from 5 to 9 p.m. held 29% of residential heating fires (USFA, Dec 2021).
Where do house fires start, and what burns first?
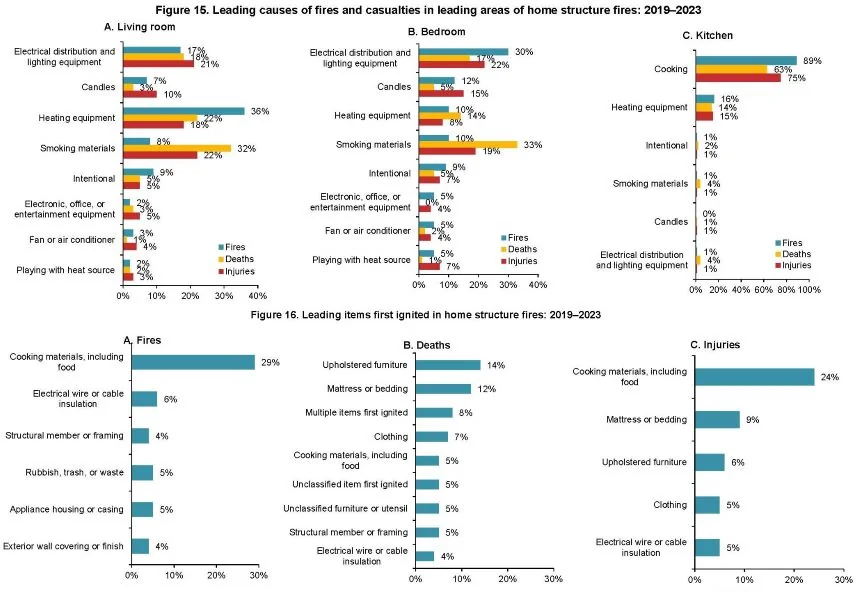
Kitchen fires are the most common. The deadliest fires start where people sleep and relax.
Which rooms matter most?
- Kitchens or cooking areas held 41% of home fires but 16% of the deaths in 2019 to 2023 (NFPA, Aug 2025).
- Bedrooms held 6% of fires and 24% of deaths, and living rooms 5% of fires and 25% of deaths (NFPA, Aug 2025).
- Smoking materials caused 33% of bedroom fire deaths (NFPA, Aug 2025).
- Nonconfined residential fires started in kitchens or cooking areas 21% of the time (USFA, May 2021).
What burns first in the deadliest fires?
- Upholstered furniture was the first item ignited in 1% of home fires but 14% of the deaths (NFPA, Aug 2025).
- Mattresses and bedding were the first item ignited in 2% of home fires but 12% of the deaths (NFPA, Aug 2025).
- CPSC tied upholstered furniture to 420 deaths a year (17.3% of the total) and mattresses to 320 (13.1%) in 2018 to 2020 (CPSC, Aug 2023).
- In England, textiles, upholstery and furnishings were the first item ignited in 27% of primary dwelling fires and the main material in fire spread in 22%, but they were linked to 48% of the deaths (MHCLG, Aug 2026).
How do the causes of house fires compare in England and Wales?
England and Wales publish cause and outcome data in the same tables. The pattern matches the US: cooking leads the count, smoking materials lead the deaths.
How has the English ranking moved?
- Cooking appliances accounted for 50% of accidental dwelling fires in the year ending March 2011 and 42% in the year ending March 2026, a 37% fall in the number of fires (MHCLG, Aug 2026).
- 27% of dwelling fires in England were caused by misuse of equipment or appliances (MHCLG, Aug 2026).
What does Wales show?
- Cooking appliances were the source of ignition in 45% of accidental dwelling fires in Wales in 2024 to 2025 (Welsh Government, Dec 2025).
- Misuse of equipment or appliances caused 28% of accidental dwelling fires (Welsh Government, Dec 2025).
- Smokers’ materials caused 7% of accidental dwelling fires, a rise of 44% on the year before (Welsh Government, Dec 2025).
- Since 2009 to 2010, smokers’ materials accounted for 33% of fire deaths in accidental dwelling fires, against 12% for cooking appliances, which caused 53% of non-fatal casualties (Welsh Government, Dec 2025).
Methodology and Sources
This page uses only the groups that collected or estimated the data: NFPA, USFA, CPSC, the Centers for Disease Control and Prevention, the U.S. Energy Information Administration, and the governments of England and Wales. Each figure was checked against the source page or report, and aggregator pages that repeat these numbers were not used. NFPA and USFA both build national estimates from the same federal incident system, but they group causes differently, so their rankings differ. CPSC excludes intentional fires and covers consumer products. Time periods differ by report and are named in each line. Reported fires are only fires that reached a fire department. This page is not code advice. Check the adopted code year and the local authority before any electrical work. The page is reviewed and refreshed monthly.
Glossary
- NFPA: National Fire Protection Association.
- USFA: U.S. Fire Administration, part of FEMA.
- CPSC: U.S. Consumer Product Safety Commission.
- NFIRS: National Fire Incident Reporting System, the federal database of fire department reports.
- Confined fire: a small fire kept inside a pot, oven, chimney or similar container.
- Nonconfined fire: a fire that spreads beyond the object where it started.
- Heat source: what supplied the heat that started the fire, such as a cigarette or a candle.
- MHCLG: Ministry of Housing, Communities and Local Government, England.
Sources
- NFPA, Home Structure Fires: Supporting Tables, Aug 2025
- NFPA, Home Cooking Fires, Sep 2023
- NFPA, Home Structure Fires, Aug 2025
- NFPA, News release: U.S. home heating fires peak during winter months, Jan 2026
- NFPA, Home Heating Fires, Dec 2022
- NFPA, Home Candle Fires, May 2020
- NFPA, Home Electrical Fires, May 2026
- NFPA, Intentional Structure Fires, Sep 2021
- USFA, Portable Heater Fires in Residential Buildings (2017-2019), Dec 2021
- USFA, Residential Building Fires (2017-2019), May 2021
- USFA, Thanksgiving Day Fires in Residential Buildings (2017-2019), Nov 2021
- USFA, Residential Building Fire Causes (2014-2023), Feb 2025
- USFA, Residential Building Electrical Malfunction Fire Trends (2014-2023), Feb 2025
- USFA, Residential Building Intentional Fire Trends (2014-2023), Feb 2025
- USFA, Residential Building Heating Fire Trends (2014-2023), Feb 2025
- USFA, Residential Building Cooking Fire Trends (2014-2023), Feb 2025
- USFA, Cooking Fires in Residential Buildings (2017-2019), Jul 2021
- USFA, Heating Fires in Residential Buildings (2017-2019), Dec 2021
- USFA, Residential Building Smoking Fire Trends (2014-2023), Feb 2025
- CPSC, 2018-2020 Residential Fire Loss Estimates, Aug 2023
- CPSC, Child-Resistant Lighters Bring Down Fire Deaths, Nov 2000
- MHCLG, Detailed analysis of fires and response times to fires attended by fire and rescue services, England, year ending March 2026, Aug 2026
- Welsh Government, Fire and rescue incident statistics: April 2024 to March 2025, Dec 2025
- EIA, In 2020, most U.S. households prepared at least one hot meal a day at home, Aug 2022
- EIA, Nearly 5% of U.S. households did not use space heating in 2020, Mar 2023
- CDC, Tobacco Product Use Among Adults, United States, 2019, Nov 2020
Cite this page
Every figure links to the source that published it. Quote one with a link to this page or to the source.
WireGaugeCalc. "111 House Fire Causes Statistics October 2026." WireGaugeCalc, October 2026. https://www.wiregaugecalc.com/statistics/house-fire-causes-statistics/ <a href="https://www.wiregaugecalc.com/statistics/house-fire-causes-statistics/">House Fire Causes Statistics</a> (WireGaugeCalc, October 2026)