 WireGaugeCalc
141 EV Charging Statistics October 2026
On this page
- How Big Is the Global EV Charging Network?
- Which Countries Have the Most Public EV Chargers?
- How Many EV Charging Stations and Ports Does the US Have?
- How Fast Is EV Charging Infrastructure Growing?
- What Do Level 1, Level 2 and DC Fast Chargers Deliver?
- How Much EV Charging Happens at Home?
- How Reliable Are Public EV Chargers?
- What Does It Cost to Charge an EV?
- What Has the Federal NEVI Program Built So Far?
- Can a Home Electrical Panel Handle a Level 2 Charger?
- How Many Chargers Will the US Need by 2030?
- Glossary
- Methodology and Sources
- Sources
Updated October 20, 2026. Refreshed monthly.
EV charging statistics for 2026 describe a network that is large, fast and uneven. The count of chargers keeps rising, but most of the charging still happens on a private circuit in a garage, and the public network is judged by whether a plug works the first time.
This page collects primary data only: government agencies, national labs, regulators, company filings and the research groups that ran the surveys. Every figure carries its source, its date and a link to the document. Where a number moves daily, such as the national port count, the date it was read is stated.
Electricians sit in the middle of this build-out. Each public port needs a feeder, and each home charger needs a circuit and a panel with room for it. Two sections cover the home side: home charging, and what a home panel can carry.
Key Takeaways
- More than 7 million public charging points existed worldwide at the end of 2025, after nearly 1.8 million were added in one year, a rise of more than 33% (IEA, May 2026).
- 261,034 public charging ports at 82,721 stations were listed in the US on October 20, 2026 (AFDC, Oct 2026).
- 21.01 million charging points were in service in China at the end of February 2026, up 47.8% in a year (National Energy Administration, Mar 2026).
- 33 electric cars share each US public charging point, up from fewer than 20 in 2020 (IEA, May 2026).
- 86% of typical EV charging happens at home (JD Power, Mar 2026).
- More than 80,000 DC fast-charging ports now operate in the US, across 14,614 stations (Paren, Oct 2026).
- 12% of public charging visits ended with no charge, the lowest rate in the study’s history and down from 14% a year earlier (JD Power, Aug 2026).
- Federal NEVI rules require average annual uptime above 97% at each charging port (eCFR, Sep 2026).
- 183 NEVI-funded stations had opened across 20 states by June 2026, from a program funded at $5 billion (CRS, Jun 2026).
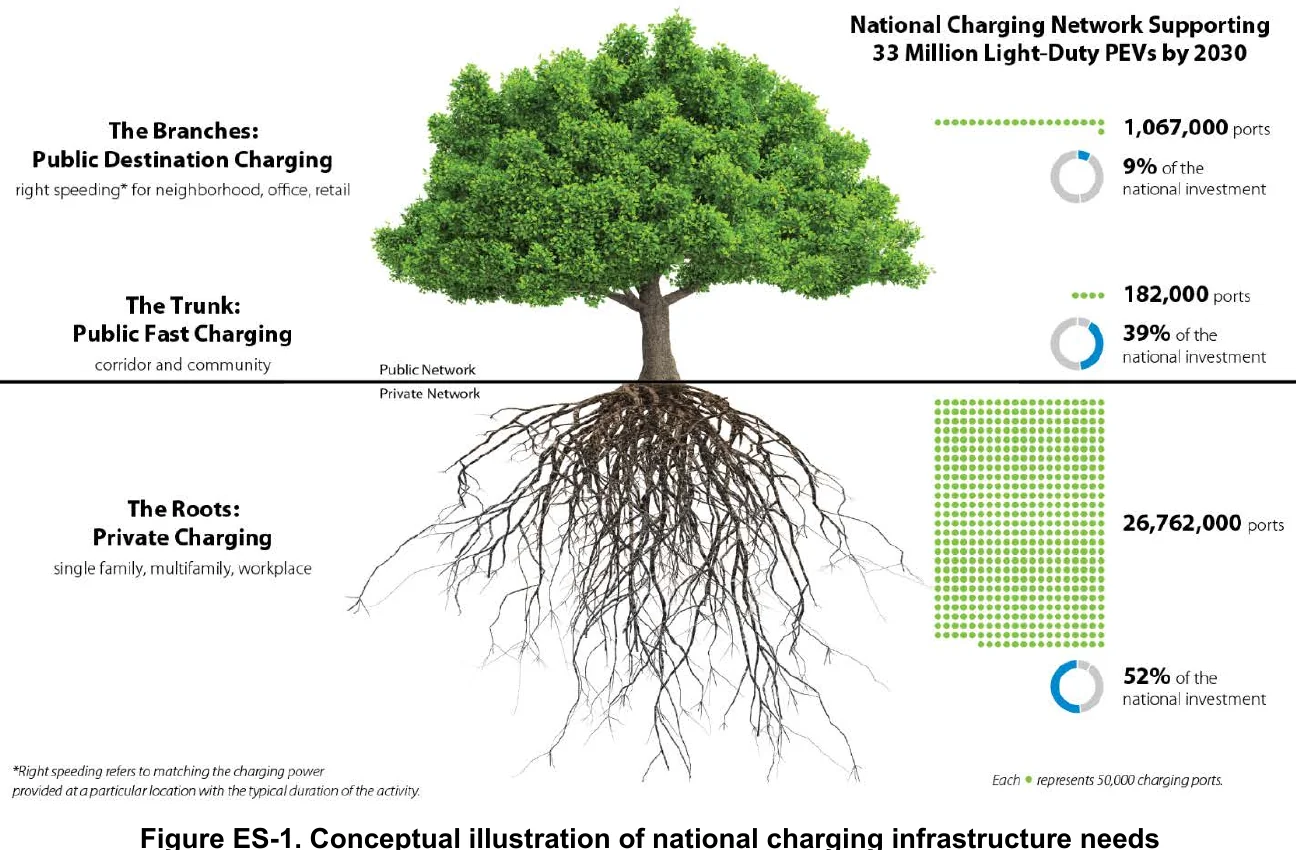
- A 2030 network for 33 million plug-in vehicles could need about 28 million ports, and 26.8 million of them would be private (NLR, Jun 2023).
- 58% of US single-family homes have a 200A or larger panel, and 31% have a 100A panel or smaller (LBNL, Feb 2026).
- Tesla’s share of US fast-charging ports fell to 49.3% from 54.3% in a year (Paren, Oct 2026).
How Big Is the Global EV Charging Network?
Most charging points in the world are not public. The private network of home and workplace chargers is several times larger than the public one, and it is the part that grows without headlines.
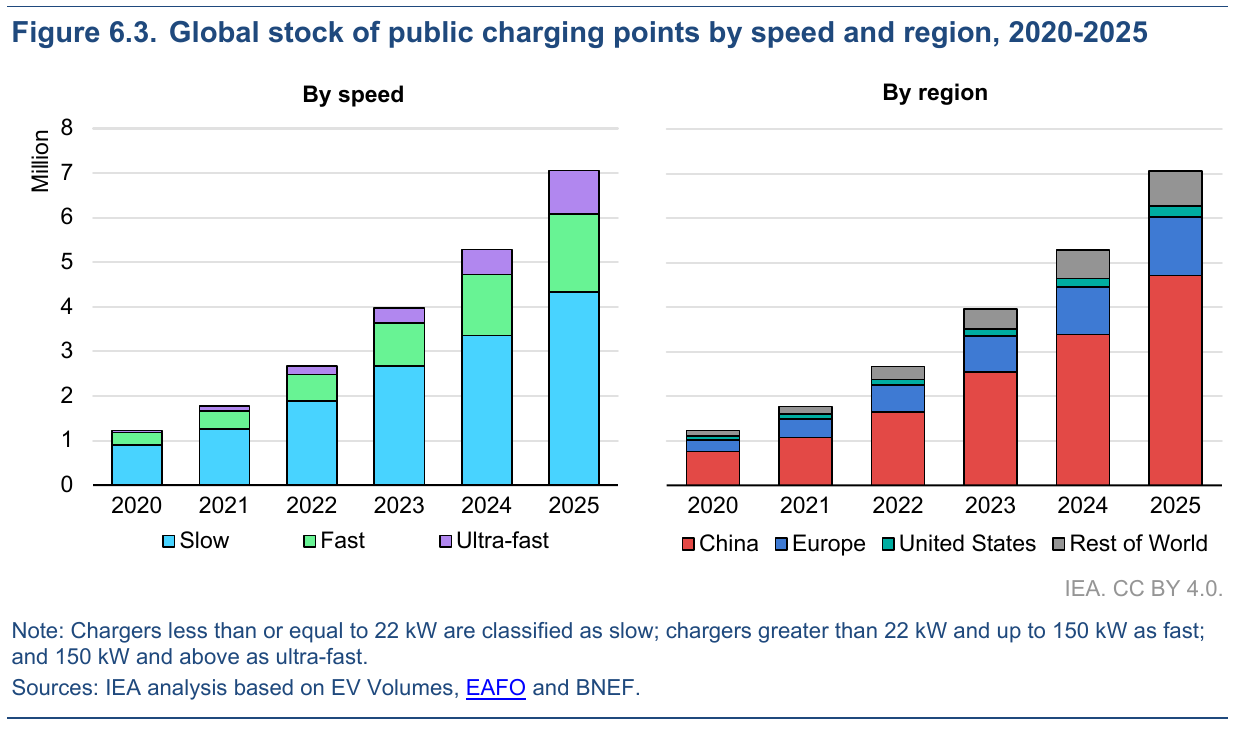
How many public charging points are there?
- Public charging capacity averaged 4.5 kW per electric car worldwide at the end of 2025 (IEA, May 2026).
- About 11 electric cars shared each public charging point worldwide in 2025, close to the 2024 level (IEA, May 2026).
- The average public charging point rose from just over 40 kW in 2024 to nearly 50 kW in 2025 (IEA, May 2026).
- China held more than 65% of the world’s public charging points (IEA, May 2026).
- The US held 3% of global public charging points while owning 10% of the global electric car stock (IEA, May 2026).
How many private chargers are there?
- More than 43 million private charging points supported a stock of around 76 million electric cars at the end of 2025 (IEA, May 2026).
- About one-third of private points are in China, one-third in Europe and one in six in the US (IEA, May 2026).
- EV owners worldwide charge privately almost 75% of the time and use public fast chargers 10% of the time, per a 2025 survey the IEA cites (IEA, May 2026).
- Electric car sales passed 20 million in 2025, up 20% on 2024 (IEA, May 2026).
Which Countries Have the Most Public EV Chargers?
Raw counts hide the real gap. China and Europe lead on points, but the number of cars sharing each point is what a driver feels at the plug.
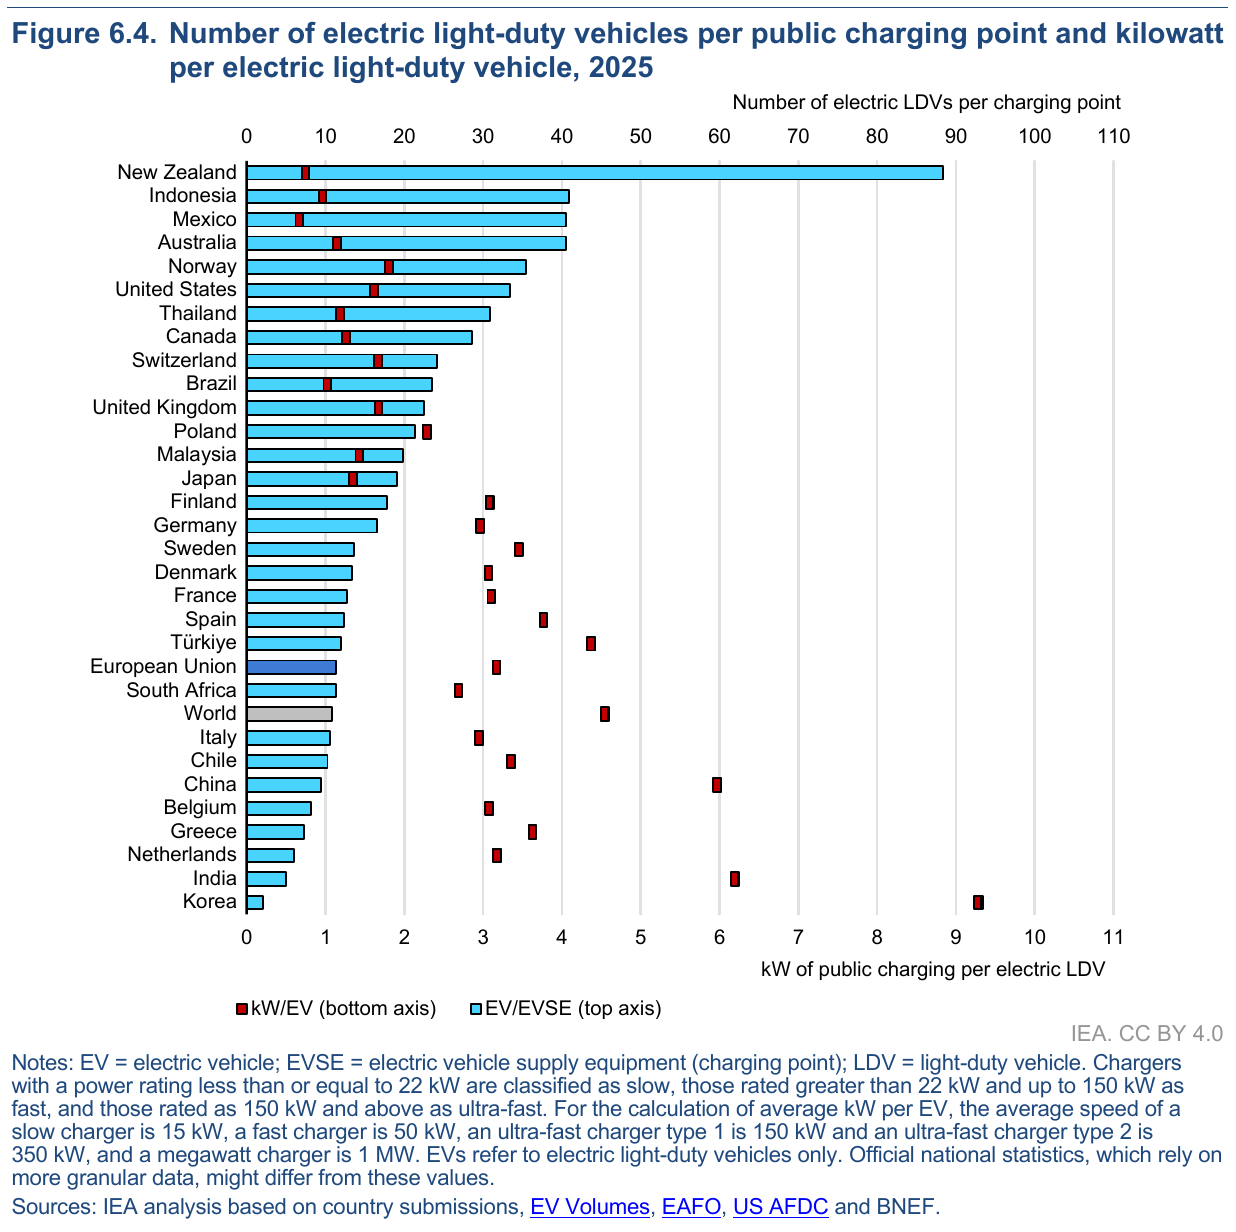
How big is China’s network?
- China’s public charging points grew from nearly 3.4 million to over 4.7 million in 2025 (IEA, May 2026).
- Public charging facilities numbered 4.834 million at the end of February 2026, up 28.8% in a year (National Energy Administration, Mar 2026).
- Private charging facilities numbered 16.176 million, up 54.6% in a year (National Energy Administration, Mar 2026).
- China’s October 2025 action plan targets 28 million charging facilities and public capacity above 300 million kilowatts by the end of 2027 (National Energy Administration, Mar 2026).
How does Europe compare?
- The Netherlands had the most public points in Europe at the end of 2025 with 210,000, ahead of Germany at 196,000 and France at 185,000 (IEA, May 2026).
- The UK listed 121,171 public chargers on July 1, 2026, or 174.9 per 100,000 people (UK Department for Transport, Aug 2026).
- The UK had one public charger for every 17 battery electric cars on April 1, 2026 (UK Department for Transport, Aug 2026).
- Europe’s car makers estimate the EU needs 8.8 million public charging points by 2030 (ACEA, Apr 2024).
What about North America, Australia and Asia?
- Canada had 27 electric vehicles for each public charger on March 31, 2026 (Transport Canada, Aug 2026).
- Australia counted 4,268 public charging locations in June 2026, up 235% in a year (Electric Vehicle Council, Sep 2026).
- Korea offers the most public charging capacity per electric car of any country, over 9 kW (IEA, May 2026).
- India reached 88,000 public charging points in 2025, up 15% (IEA, May 2026).
How Many EV Charging Stations and Ports Does the US Have?
The US network is big and lopsided. One state holds more than a quarter of the ports, and the smallest states list a few hundred.
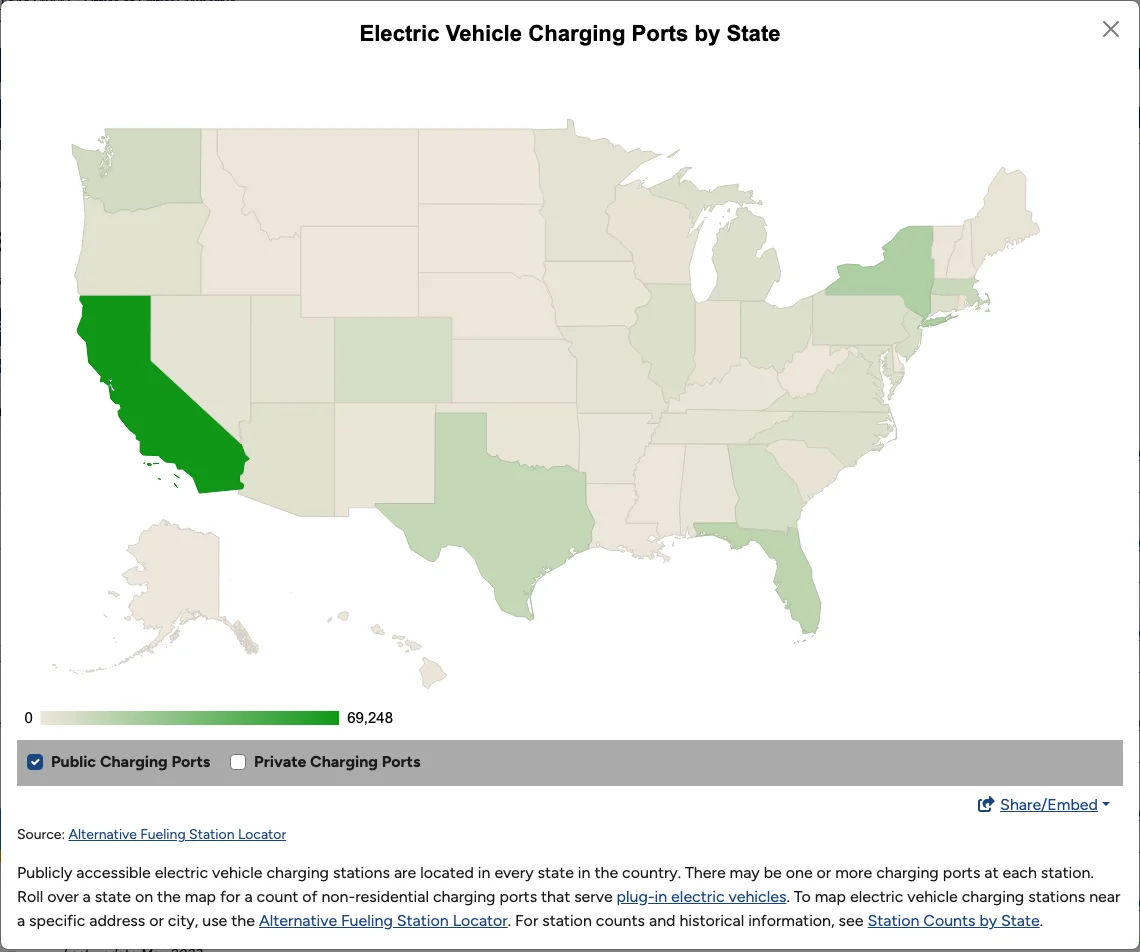
How many ports of each type are there?
- Level 2 ports number 181,365 (AFDC, Oct 2026).
- DC fast ports number 78,964 (AFDC, Oct 2026).
- Public Level 1 ports number just 693 (AFDC, Oct 2026).
Which states have the most?
- California lists 69,248 public ports at 20,182 stations (AFDC, Oct 2026).
- New York lists 20,215 ports, Florida 15,369 and Texas 13,005 (AFDC, Oct 2026).
- Wyoming lists 355 ports and North Dakota 283 (AFDC, Oct 2026).
How close is a charger to where people live?
- 64% of Americans lived within 2 miles of a public charging station in early 2024 (Pew Research Center, May 2024).
- 39% lived within one mile (Pew Research Center, May 2024).
- 60% of urban residents lived within a mile of a station, against 17% of rural residents (Pew Research Center, May 2024).
- Public stations more than doubled from about 29,000 in December 2020 to over 61,000 in February 2024 (Pew Research Center, May 2024).
What does a dense state look like?
- California counted 201,180 fully public and shared charging ports in September 2025, 68% more than its gasoline nozzles (California Energy Commission, Sep 2025).
- 94% of Californians lived within 10 minutes of an EV charger (California Energy Commission, Sep 2025).
How Fast Is EV Charging Infrastructure Growing?
Growth continues, but it has changed shape. Fewer sites open each quarter, and each new site is larger.
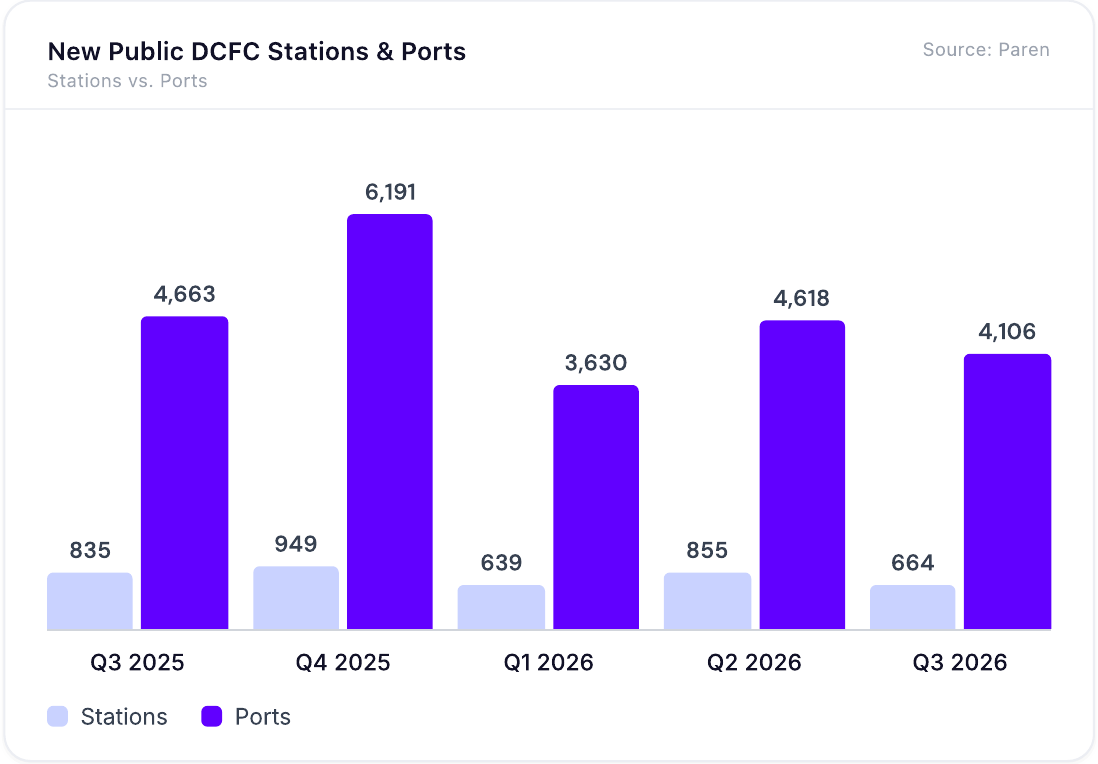
How many fast chargers opened this year?
- The US added 664 DC fast stations and 4,106 ports in Q3 2026 (Paren, Oct 2026).
- Operators opened 2,158 stations through Q3 2026, about 20% fewer than the 2,696 opened through Q3 2025 (Paren, Oct 2026).
- New non-Tesla sites averaged 5.0 ports, up from 4.1 a year earlier (Paren, Oct 2026).
- Tesla opened 1,287 new ports in Q3, a 31.3% share of new ports (Paren, Oct 2026).
What do the big builders report?
- Tesla’s worldwide network reached 8,704 Supercharger stations and 82,357 connectors in Q2 2026 (Tesla, Jul 2026).
- Tesla added over 2,400 net new Supercharging stalls in Q2 2026, and its network is 17% larger than a year earlier (Tesla, Jul 2026).
How does 2025 look in hindsight?
- The US added a record number of public points in 2025, 20% more than in 2024 (IEA, May 2026).
- US fast and ultra-fast points grew 30% to nearly 70,000 (IEA, May 2026).
- US slow public points reached over 160,000 (IEA, May 2026).
What is demand doing?
- EVs took about 6.4% of new-vehicle sales in Q3 2026, up from 5.8% in Q2 (Cox Automotive, Oct 2026).
- EV sales in Q3 2026 were down 39.5% from the record Q3 2025 (Cox Automotive, Oct 2026).
What Do Level 1, Level 2 and DC Fast Chargers Deliver?
The charger level sets how long a stop takes, and it also sets the wiring behind the plug. The public network is moving toward much higher power, while homes mostly run on 240 volts.
How much range does each level add?
- Level 1 adds about 5 miles of range per hour on a 120 volt outlet (AFDC, Oct 2026).
- Level 2 adds about 25 miles of range per hour (AFDC, Oct 2026).
- DC fast charging adds 100 to 200 or more miles per 30 minutes, at up to 500 kW (AFDC, Oct 2026).
- Nearly 80% of US public ports were Level 2 in 2023 (AFDC, Oct 2026).
How powerful are new fast chargers?
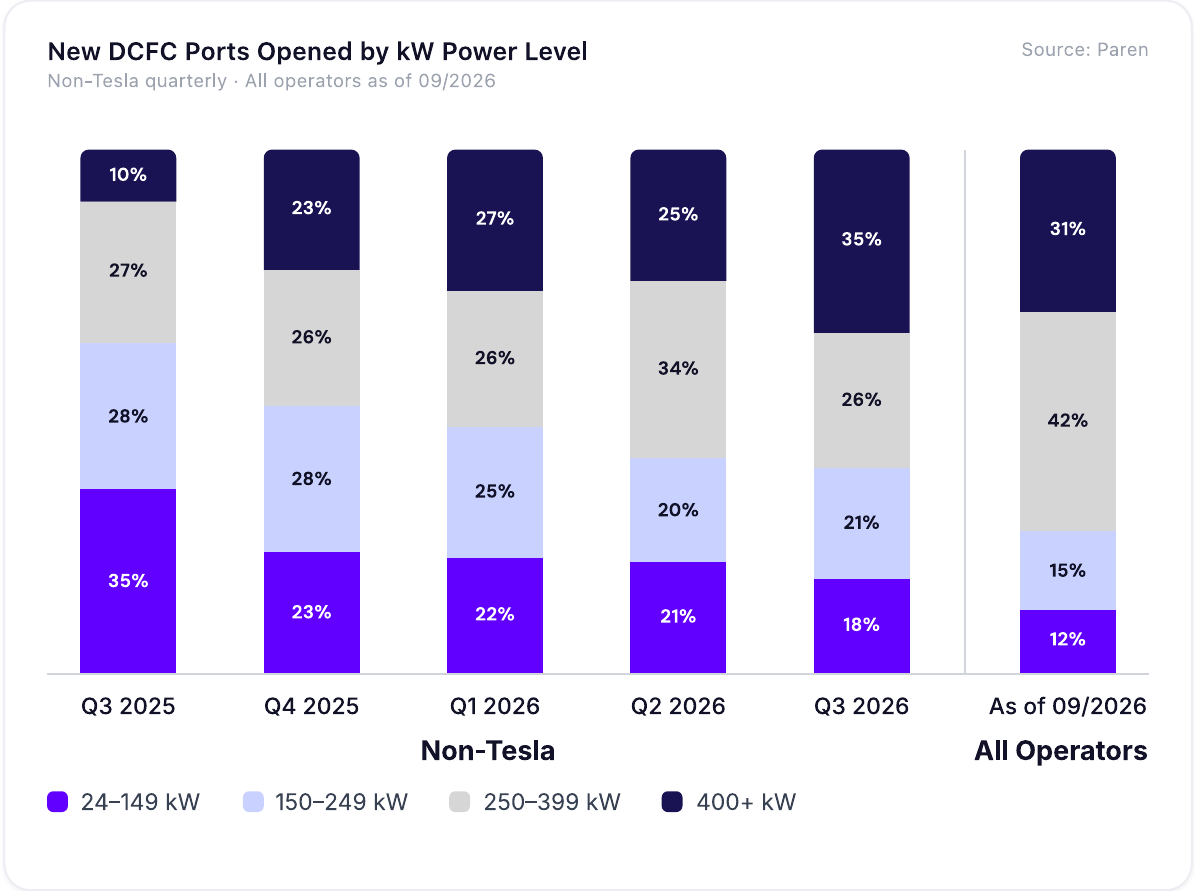
- 73% of new fast ports installed in Q3 2026 are rated at 250 kW or more, up from 60% a year earlier (Paren, Oct 2026).
- 35% of new non-Tesla ports are rated at 400 kW or more, up from 10% a year earlier (Paren, Oct 2026).
- NACS made up 23% of new non-Tesla connectors in Q3 2026, and CCS still made up 74% (Paren, Oct 2026).
- Only about 30% of battery electric cars can use ultra-fast charging today (IEA, May 2026).
- Just 50 of 670 battery electric car models can charge above 250 kW (IEA, May 2026).
What circuit does a home Level 2 charger need?
- AFDC says most residential Level 2 chargers draw up to 30 amps, which is 7.2 kW, and need a dedicated 40-amp circuit to comply with NEC Article 625 (AFDC, Oct 2026).
- AFDC notes that the NEC considers EV charging equipment a continuous load (AFDC, Oct 2026).
- Under the 2026 NEC, cord-and-plug charging equipment rated 60 amperes or less, or 150 volts to ground or less, may use the cord and plug as its disconnecting means (NFPA, Apr 2026).
How Much EV Charging Happens at Home?
Home is the default fuel stop, and public charging fills the gaps. How much a driver pays and how well it works then depends on the charger and on whether it is scheduled.
Where do EV owners charge?
- More than three-quarters of US EV owners charged at home in 2020 (EIA, Mar 2022).
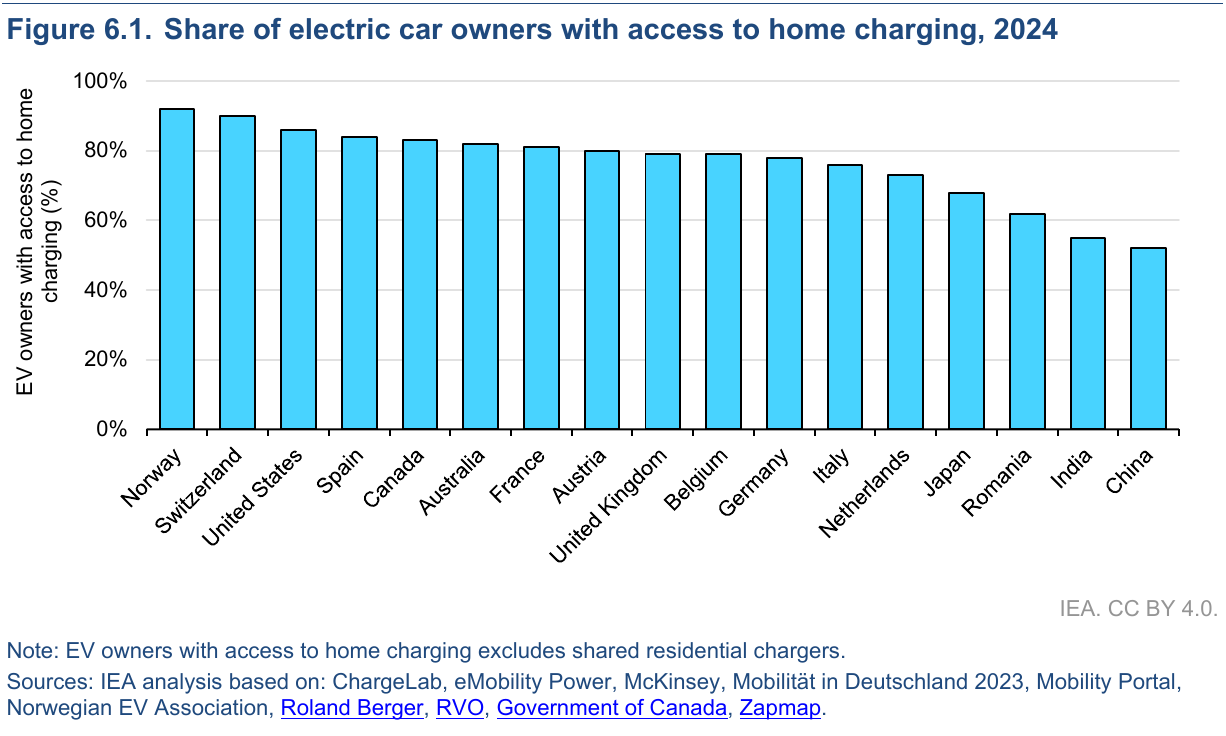
- Around 90% of EV owners in Norway can charge at home (IEA, May 2026).
- Only about 50% of EV owners in China have a home charger (IEA, May 2026).
- Fewer than one-third of EV drivers charge every day (Plug In America, Jul 2026).
- The 2030 network model assumes 90% of plug-in vehicle drivers have reliable overnight home charging (NLR, Jun 2023).
What does home charging cost and how well does it work?
- Owners spent an average of $63 on home charging in the past 30 days, up $5 in a year (JD Power, Mar 2026).
- New England owners spent the most at $99, and Mountain region owners the least at $36 (JD Power, Mar 2026).
- 38% of owners always schedule home charging, and 46% never do (JD Power, Mar 2026).
- 69% of owners know about utility smart charging programs, and only 12% are enrolled (JD Power, Mar 2026).
- Wall-mounted Level 2 chargers log 44.2 problems per 100 chargers, the most of any home type, yet they earn the highest satisfaction (JD Power, Mar 2026).
- Satisfaction scores 733 for wall-mounted Level 2 chargers and 569 for portable Level 1 cords (JD Power, Mar 2026).
Do homes have a place to park and plug in?
- Two-thirds of US housing units had a garage or carport in 2021 (DOE, Dec 2022).
- The Pacific region had the highest share of homes with a garage or carport at 80%, and the Middle Atlantic the lowest at 53% (DOE, Dec 2022).
- California had an estimated 800,000 EV chargers in single-family homes in September 2025 (California Energy Commission, Sep 2025).
How Reliable Are Public EV Chargers?
Reliability is the number that decides whether a driver trusts the network. It is improving, but it is not uniform, and it differs sharply by state and by charger type.
How do fast chargers score on reliability?
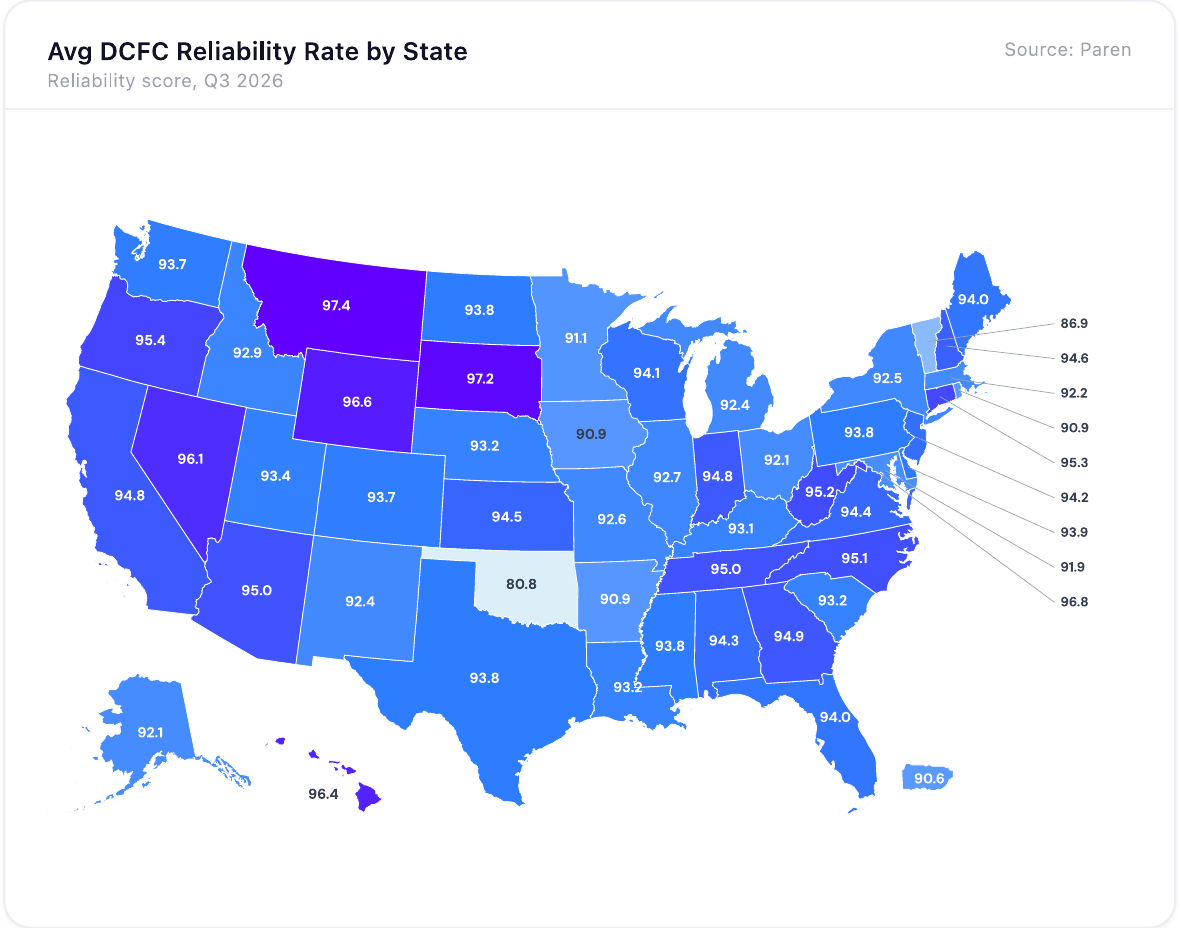
- The national reliability score was 93.9 in Q3 2026 against 93.7 a year earlier, and 29 of 52 states and territories declined (Paren, Oct 2026).
- 50 of 52 states and territories scored 90 or higher, up from 46 a year earlier (Paren, Oct 2026).
- Montana led at 97.4, and Oklahoma trailed at 80.8 (Paren, Oct 2026).
- States above 15% utilization averaged 94.4 on reliability, against 91.7 for states below 8% (Paren, Oct 2026).
What do drivers say?
- DC fast charging satisfaction rose 12 points to 666 on a 1,000-point scale (JD Power, Aug 2026).
- Public Level 2 satisfaction fell 12 points to 595 (JD Power, Aug 2026).
- Charger availability scores at DC fast sites gained 27 points in a year (JD Power, Aug 2026).
- DC fast chargers at hotels score 692, while those at dealerships score 570 (JD Power, Aug 2026).
- The share of drivers on non-Tesla networks who met a broken charger in the past year fell by almost 10% (Plug In America, Jul 2026).
What do the rules require?
- California requires 97% uptime, measured per port, for state-funded DC fast chargers installed after January 1, 2024, for six years (California Energy Commission, Oct 2026).
- California DC fast chargers installed after September 27, 2026 must support OCPP 2.0.1 (California Energy Commission, Oct 2026).
How busy are fast chargers?
- National utilization was 15.9% in Q3 2026, and has stayed between 15.7% and 16.5% for five quarters (Paren, Oct 2026).
- Ports in the top 30 metros ran at 21.1% utilization, about twice the 11.0% everywhere else (Paren, Oct 2026).
- Fast-charging sessions reached 50.4 million in Q3 2026, up 26% in a year (Paren, Oct 2026).
What Does It Cost to Charge an EV?
Home charging is cheap and public fast charging is not. The gap depends on the network, the state and the time of day.
What do public fast chargers charge?
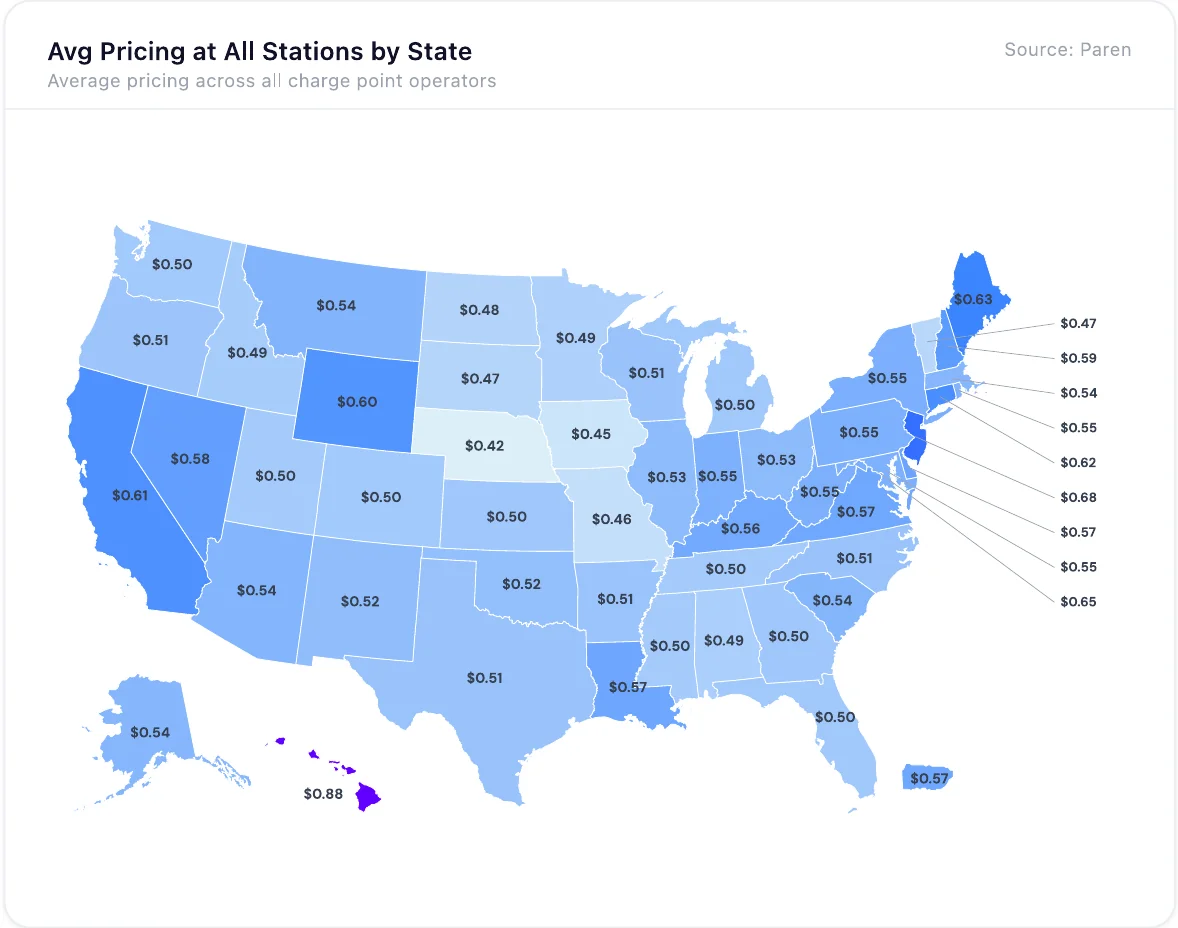
- The national average reached $0.540 per kWh in Q3 2026, up 2.7% in a year (Paren, Oct 2026).
- Tesla’s non-member price rose 15% to $0.569, while its member price rose 9% to $0.396 (Paren, Oct 2026).
- Hawaii was the most expensive state at $0.877, and Nebraska the cheapest at $0.424 (Paren, Oct 2026).
- Among stations that price per kWh, 72.9% use a fixed rate and 27.1% use time-of-use pricing (Paren, Oct 2026).
- Peak time-of-use prices reached $0.637 per kWh, against $0.438 off-peak (Paren, Oct 2026).
How does that compare with home power and gasoline?
- Residential electricity averaged 18.31 cents per kWh in July 2026, up 4.9% in a year (EIA, Jul 2026).
- Public slow charging can cost up to 150% more than residential tariffs, and public fast charging up to 240% more (IEA, May 2026).
- A US battery electric car saved about $860 a year in running costs against a gasoline car in 2025 (IEA, May 2026).
- With April 2026 fuel prices, that US saving rose from around $900 to $1,300 a year (IEA, May 2026).
What happened to the charger tax credit?
- The federal 30C credit for charging equipment ended on June 30, 2026 (AFDC, Jun 2026).
- For businesses, the credit was 30% of depreciable costs up to $100,000 per item when prevailing wage and apprenticeship rules were met (AFDC, Jun 2026).
- For homeowners, the credit was up to 30% of the cost, capped at $1,000 (AFDC, Jun 2026).
What Has the Federal NEVI Program Built So Far?
The federal program is large on paper and small on the ground. Money moves slowly because every state plan, contract and site has to clear before a plug is energized.
How much money has moved?
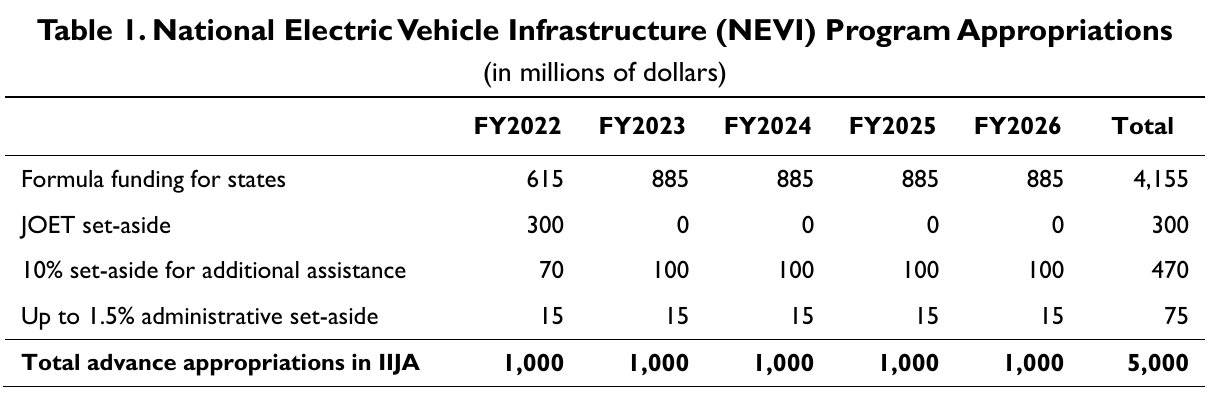
- The infrastructure law provided $7.5 billion over five years for NEVI and its sister grant program, CFI (CRS, Jun 2026).
- $4.2 billion in NEVI formula funds has been made available to states since FY2022 (CRS, Jun 2026).
- $527 million had been obligated by February 6, 2025 (CRS, Jun 2026).
- Obligations reached $1.4 billion of the $4.2 billion by December 31, 2025 (CRS, Jun 2026).
- CFI awards went to 147 projects across 44 states, and 143 of them support EV charging (CRS, Jun 2026).
How many chargers are open?
- 384 chargers funded by NEVI and CFI were open to the public in April 2025 (GAO, Jul 2025).
- Around 550 NEVI-funded fast charging points were operating across 19 states by April 2026 (IEA, May 2026).
- Another 1,000 charging points have been fully awarded funding from FY2022 to FY2025 allocations (IEA, May 2026).
- Pennsylvania has opened the most NEVI stations at 36, followed by Ohio at 21 (CRS, Jun 2026).
What rules and pauses shape the program?
- An executive order on January 20, 2025 directed a 90-day pause of NEVI and CFI disbursements (CRS, Jun 2026).
- NEVI obligations were paused from February 2025 to January 2026 (IEA, May 2026).
- NEVI stations on designated corridors must have at least four network-connected DC fast ports, each able to deliver at least 150 kW (eCFR, Sep 2026).
- 92% of the Interstate System is designated as an alternative fuel corridor (GAO, Jul 2025).
Can a Home Electrical Panel Handle a Level 2 Charger?
On paper, most homes can add one. The limit is often breaker space, not amps, and a panel swap is the cost that stops projects. These are modeled national estimates, not a check of any one house. Check the adopted code year and the local authority before you size anything.
How big are home panels?
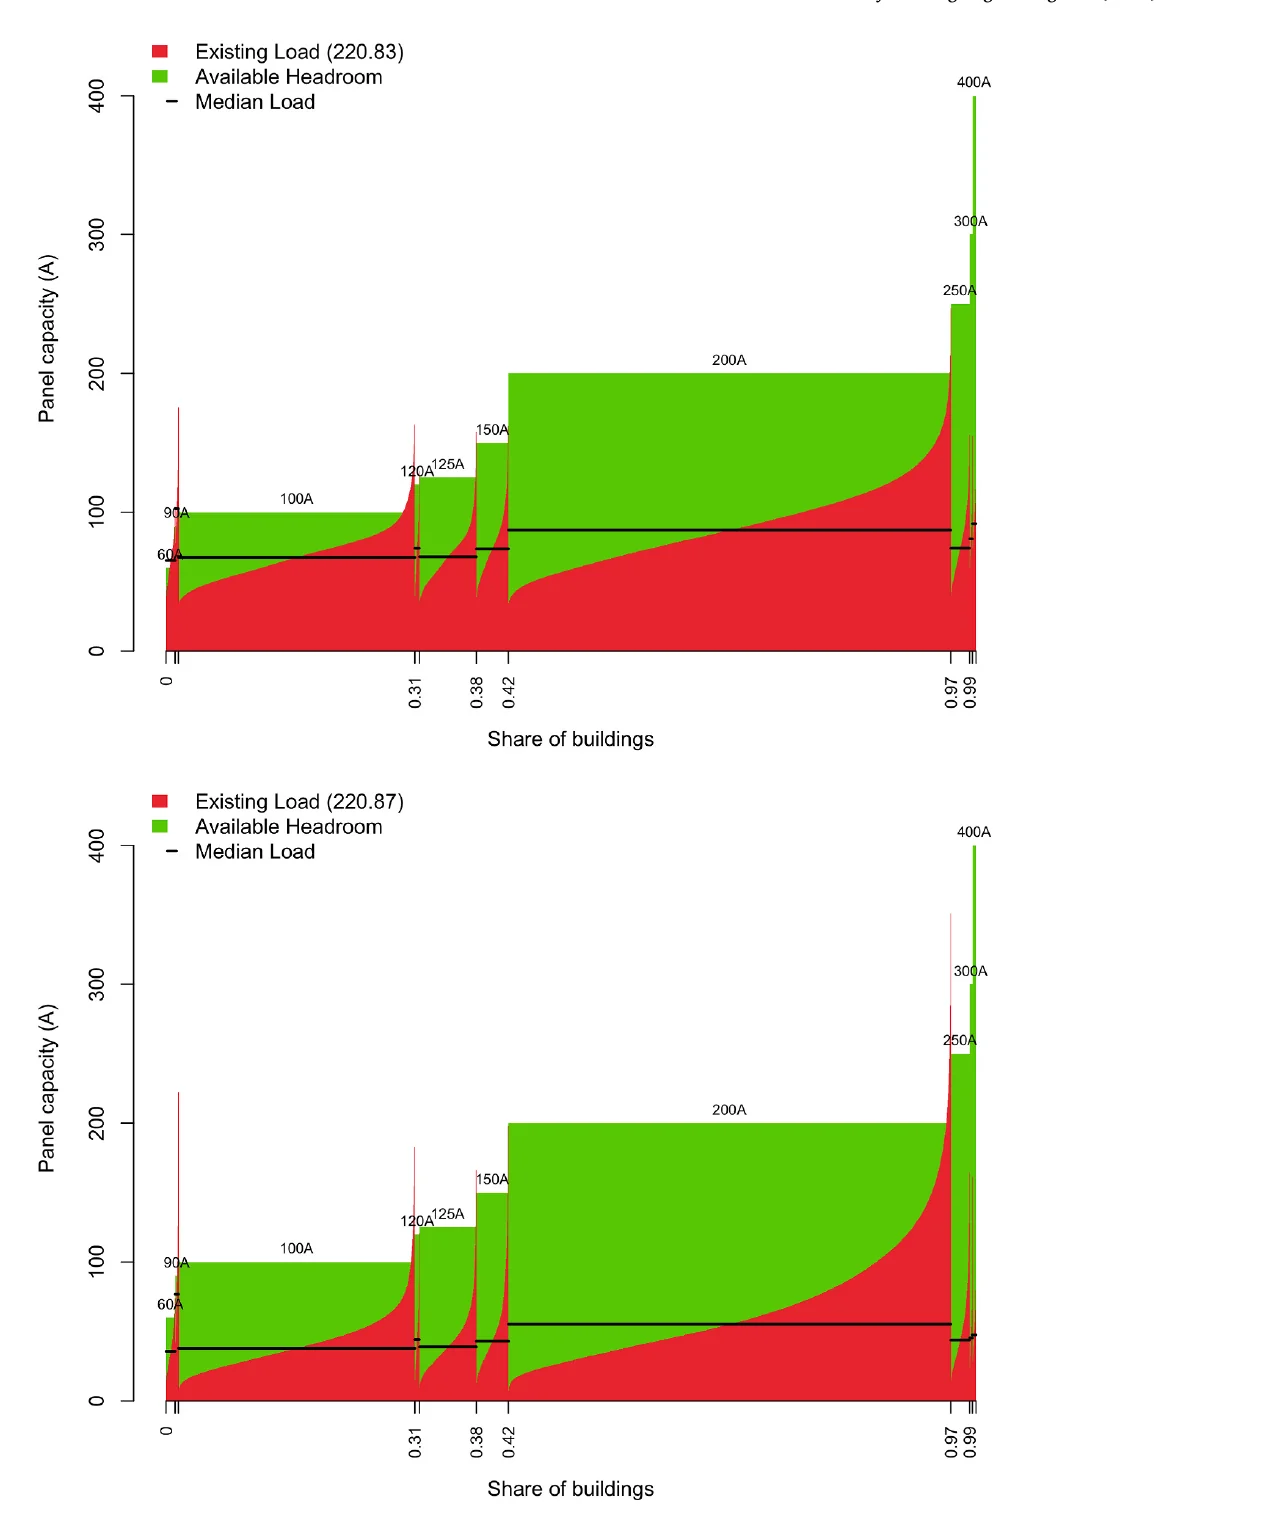
- 100A panels are the most common size below 200A, found in 29% of single-family homes (LBNL, Feb 2026).
- 25% of homes with 100A panels have no open breaker spaces, as do 20% of homes with 200A panels (LBNL, Feb 2026).
- 48% of homes with 200A panels have five or more open breaker spaces (LBNL, Feb 2026).
How much room is left for a new load?
- Using the NEC 220.87 maximum demand method, the median existing load is 55A in homes with a 200A panel and 38A in homes with a 100A panel (LBNL, Feb 2026).
- Median headroom under that method ranges from 27A to 30A across panel sizes (LBNL, Feb 2026).
- Existing loads from the maximum demand method run 40% lower than from the load summing method for the median home (LBNL, Feb 2026).
- The study modeled a Level 2 charger at 7,680 VA (LBNL, Feb 2026).
What does the 2026 NEC add for chargers?
- New section 625.4 requires charging installations to be done by qualified persons (NFPA, Apr 2026).
- New section 625.5 requires field marking of supply voltage, phases, frequency, full-load current and short-circuit current rating (NFPA, Apr 2026).
- For buildings other than one- and two-family homes, an emergency disconnect must sit between 20 and 100 feet from the equipment (NFPA, Apr 2026).
How Many Chargers Will the US Need by 2030?
Most of the future network is private. The public fast charger is the small, costly part of the plan, and the part drivers see.
How big is the 2030 estimate?
- The 2030 network could be 26 to 35 million ports to support 30 to 42 million plug-in vehicles (NLR, Jun 2023).
- About 1 million of those would be public Level 2 ports near homes and workplaces (NLR, Jun 2023).
- The cumulative investment need is $53 to $127 billion, including private home charging (NLR, Jun 2023).
- Public charging alone needs $31 to $55 billion (NLR, Jun 2023).
Who needs the public fast chargers?
- 65% of the simulated fast ports serve drivers without reliable overnight home charging (NLR, Jun 2023).
- Ride-hailing accounts for 21% of simulated fast-charging demand and long-distance travel for 14% (NLR, Jun 2023).
- Chargers rated at 350 kW or more are expected to be the most common fast charger by 2030 (NLR, Jun 2023).
- The size of the public network could vary by up to 50% with plug-in hybrid share, charging etiquette and home access (NLR, Jun 2023).
How does the US fleet today compare?
- DOE estimated that about 3.5 million of the nation’s 287 million vehicles were electric in 2023 (GAO, Jul 2025).
- The European Commission estimated the EU needs about 3.5 million public charging points in 2030 (ACEA, Apr 2024).
Glossary
- AFC: alternative fuel corridor, a highway that FHWA designates for alternative fuel stations.
- AFDC: Alternative Fuels Data Center, run by the US Department of Energy.
- BEV: battery electric vehicle.
- CCS: Combined Charging System, a DC fast-charging connector.
- CFI: Charging and Fueling Infrastructure grant program.
- CRS: Congressional Research Service.
- DC fast charging: direct-current charging at high power, up to 500 kW in AFDC’s description.
- EVSE: electric vehicle supply equipment, the charger itself.
- IEA: International Energy Agency.
- kW and kWh: kilowatt, a unit of power, and kilowatt-hour, a unit of energy.
- Level 1, Level 2: alternating-current charging at 120 volts and 240 or 208 volts.
- NACS: North American Charging Standard, now standardized as SAE J3400.
- NEC: the National Electrical Code, a trademark of NFPA.
- NEVI: National Electric Vehicle Infrastructure Formula Program.
- NLR: National Laboratory of the Rockies, formerly the National Renewable Energy Laboratory.
- OCPP: Open Charge Point Protocol, the software link between chargers and networks.
- Uptime: the share of time a charger is online, available and able to deliver power.
- Utilization: the share of time a port spends charging a vehicle.
Methodology and Sources
Each statistic comes from the agency, regulator, laboratory, company filing or research group that produced it. Roundups and trade-press summaries were not used as sources. Every link was opened and the figure checked against the page or document before it was kept. Counts that change daily, such as the AFDC station table, carry the date they were read. Surveys and models are reported as their authors state them, with the sample or scenario named in the source. This page is refreshed monthly.
Calculators on this site are aids. Check the adopted code year and the local authority before sizing any circuit. Related tools: electric vehicle charging calculator and NEC service load calculation.
Sources
- ACEA, Electric cars: EU needs 8 times more charging points per year by 2030
- California Energy Commission, California Exceeds 200,000 Electric Vehicle Chargers
- California Energy Commission, EV Charger Performance Standards and Uptime Reporting Regulations
- China National Energy Administration data, published by the State Council (Xinhua), March 21, 2026
- Congressional Research Service, Implementation of Electric Vehicle Charging Infrastructure Programs: CFI and NEVI (R48996)
- Cox Automotive, EV Sales in the U.S. Continue to Rise: Q3 2026
- eCFR, 23 CFR Part 680, National Electric Vehicle Infrastructure Standards and Requirements
- Electric Vehicle Council (Australia), State of EVs 2026 media release
- IEA, Global EV Outlook 2026, Electric vehicle charging (May 2026)
- IEA, Global EV Outlook 2026, Trends in electric cars (May 2026)
- JD Power, 2026 U.S. Electric Vehicle Experience (EVX) Home Charging Study
- JD Power, 2026 U.S. Electric Vehicle Experience (EVX) Public Charging Study
- Lawrence Berkeley National Laboratory and National Laboratory of the Rockies, Characterizing electrical panel capacity, breaker space, and loads in U.S. single-family homes, Journal of Building Engineering
- National Laboratory of the Rockies (formerly NREL), The 2030 National Charging Network
- NFPA Code Corner (author: NFPA staff), EV Infrastructure 2.0 and the 2026 NEC, IAEI Magazine
- Paren, State of the US Fast Charging Industry, Q3 2026
- Pew Research Center, Electric Vehicle Charging Stations Across the US
- Plug In America, 2026 EV Driver Survey
- Tesla, Q2 2026 Update
- Transport Canada, Canada’s electric vehicle (EV) dashboard
- U.S. DOE Alternative Fuels Data Center, Alternative Fuel Infrastructure Tax Credit (30C)
- U.S. DOE Alternative Fuels Data Center, Alternative Fueling Station Counts by State (read Oct 20, 2026)
- U.S. DOE Alternative Fuels Data Center, Charging Electric Vehicles at Home
- U.S. DOE Alternative Fuels Data Center, Electric Vehicle Charging Ports by State (Figure 3)
- U.S. DOE Alternative Fuels Data Center, Electric Vehicle Charging Stations
- U.S. DOE, Fact of the Week 1268: Two-Thirds of U.S. Housing Units Had a Garage or Carport
- U.S. Energy Information Administration, 2020 Residential Energy Consumption Survey release
- U.S. Energy Information Administration, Electricity Monthly Update, end-use sector table
- U.S. Government Accountability Office, GAO-25-106992, Electric Vehicle Infrastructure
- UK Department for Transport, Public electric vehicle charging infrastructure statistics: 1 July 2026
Cite this page
Every figure links to the source that published it. Quote one with a link to this page or to the source.
WireGaugeCalc. "141 EV Charging Statistics October 2026." WireGaugeCalc, October 2026. https://www.wiregaugecalc.com/statistics/ev-charging-statistics/ <a href="https://www.wiregaugecalc.com/statistics/ev-charging-statistics/">EV Charging Statistics</a> (WireGaugeCalc, October 2026)