 WireGaugeCalc
143 House Fire Statistics October 2026
On this page
- How Many Home Fires Happen in the US Each Year?
- How Many People Die or Get Hurt in Home Fires?
- How Much Do Home Fires Cost?
- Home Fire Statistics by State: Which States Fare Worst?
- When Do Home Fires Start?
- Do Smoke Alarms Cut Home Fire Deaths?
- How Well Do Home Fire Sprinklers Work?
- How Fast Does a Home Fire Spread?
- Who Responds to Home Fires, and How Fast?
- Glossary
- Methodology and Sources
- Sources
House fire statistics describe a problem that fell fast after 1980 and then stopped falling. Fewer homes burn each year than in the early 1980s, yet the chance that a reported home fire kills someone is higher now than it was then. The numbers below come from fire agencies, federal safety offices and state fire marshals, and every one links to its source.
This page covers fires in homes: houses, manufactured homes and the wider home group the agencies report. It leaves the ranking of causes, electrical fires and apartment fires to their own pages: causes, electrical fires and apartment fires. The newest full-year national estimates are for 2024. Totals for 2025 are not published yet, so each figure carries the year it describes.
Read the rates with care. Fire departments report only the fires they attend, and a rate per 1,000 fires moves when small fires go unreported. Where two agencies measure the same thing differently, both figures appear with their names.
Key Takeaways
- Fire departments responded to 329,500 home fires in 2024, one every 96 seconds (NFPA, Nov 2025).
- Home fires killed 2,920 people in 2024, or 75 percent of all US civilian fire deaths (NFPA, Nov 2025).
- The death rate was 8.9 per 1,000 reported home fires in 2024, up from 7.1 in 1980 (NFPA, Nov 2025).
- Home fires caused $11.4 billion in direct property damage in 2024 (NFPA, Nov 2025).
- In 80 percent of fatal residential fires, the fire spread beyond the room where it began (USFA, Jun 2022).
- Fifty-nine percent of home fire deaths happened in homes with no smoke alarm or an alarm that failed (NFPA, Jun 2024).
- Sprinklers operated effectively in 91 percent of home fires large enough to trigger them (NFPA, Oct 2026).
- A room with synthetic furnishings reached flashover in 4 minutes 50 seconds, while a room with natural furnishings took more than 30 minutes (UL FSRI, Sep 2020).
- An in-home test found that 84 percent of US households have at least one fully working smoke or CO alarm (CPSC, Sep 2024).
- The US death rate from all fires was 13.1 per million people in 2023, up 27 percent on the 10-year trend (USFA, Apr 2025).
- Alaska reported 23.9 deaths per 1,000 residential structure fires in 2023, the highest of any state in USFA’s profiles (USFA, Mar 2025).
- Fires with two or more deaths were under 0.1 percent of residential building fires but 26 percent of the deaths (USFA, Dec 2024).
- Only 3.4 percent of residential fires in a federal household survey were attended by a fire department (CPSC, Jul 2009).
How Many Home Fires Happen in the US Each Year?
The reported count is large and has barely moved in a decade. Home fires are under a quarter of reported fires, which is why their share of the deaths stands out.
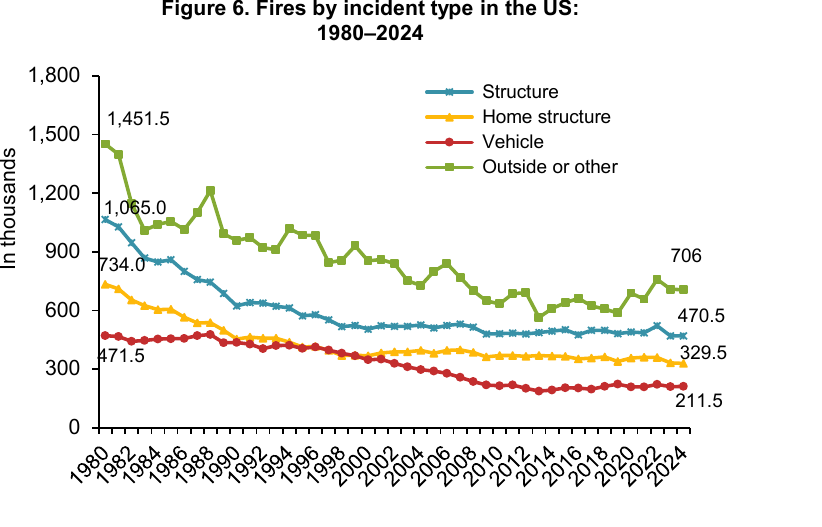
How many home fires did fire departments report in 2024?
- Home structure fires were 23 percent of the 1,388,000 fires reported in 2024 (NFPA, Nov 2025).
- One- and two-family homes, which include manufactured homes, had 253,500 of those fires (NFPA, Nov 2025).
- The U.S. Fire Administration put 2024 residential building fires at 343,000 (USFA, Jul 2026).
- Its estimate for 2023 was 344,600 residential building fires (USFA, Feb 2025).
How have home fire counts changed since 1980?
- The number of home structure fires in 2024 was 55 percent lower than in 1980 (NFPA, Nov 2025).
- Reported home fires per 1,000 people fell from 3.2 in 1980 to 1 in 2024 (NFPA, Nov 2025).
- Residential building fires fell 6 percent from 2014 to 2023 (USFA, Feb 2025).
How many home fires never reach a fire department?
Most never do. A federal telephone survey asked households about fires of any size, including ones put out at home.
- About 3.4 percent of the residential fires in the survey were attended by fire departments (CPSC, Jul 2009).
- The survey estimated 7.4 million residential fires and fire incidents in 2004 and 2005, counting small ones (CPSC, Jul 2009).
- It put the rate at 6.6 residential structure fires per year per 100 households (CPSC, Jul 2009).
- CPSC staff estimated 352,400 unintentional residential fires a year attended by fire departments from 2019 to 2021 (CPSC, Jul 2024).
- Within that period the peak was 364,100 fires in 2020 (CPSC, Jul 2024).
How Many People Die or Get Hurt in Home Fires?
Fewer people die than in 1980, but each reported fire is more likely to kill. The rate per fire is the number to watch.
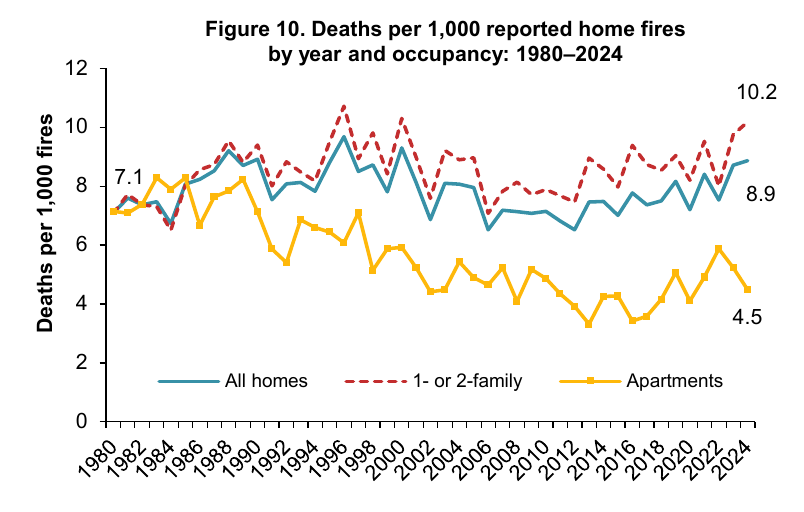
What is the home fire death and injury toll?
- Home fire deaths in 2024 were 44 percent lower than in 1980 (NFPA, Nov 2025).
- One- and two-family homes accounted for 2,580 deaths, or 66 percent of all civilian fire deaths (NFPA, Nov 2025).
- Home fires injured 8,920 civilians in 2024, and an injury occurred every 59 minutes (NFPA, Nov 2025).
- The 10.2 deaths per 1,000 fires in one- and two-family homes was the highest since 2000 (NFPA, Nov 2025).
- USFA counted 2,890 deaths and 10,400 injuries in residential building fires in 2023 (USFA, Feb 2025).
- The CPSC estimate for unintentional residential fires was 2,460 deaths a year from 2019 to 2021 (CPSC, Jul 2024).
Who is most at risk in a home fire?
- Fifty-nine percent of home fire victims who died were 55 or older (NFPA, Aug 2025).
- Thirty-nine percent of those who died were at least 65 (NFPA, Aug 2025).
- Males were 1.6 times as likely as females to die in a fire in 2022 (USFA, Nov 2024).
- Adults 85 or older had the highest relative risk of dying in a fire (USFA, Nov 2024).
- Children 4 and younger had half the relative risk of the general population, the lowest for that age group since the mid-1970s (USFA, Nov 2024).
- People in the Midwest and South had the greatest relative risk of dying in a fire (USFA, Nov 2024).
- Thirty-seven percent of home fire victims who died were trying to escape when they were fatally injured (NFPA, Aug 2025).
Which fires kill more than one person?
- About 200 fires a year killed two or more people in residential buildings from 2021 to 2023, with 720 deaths (USFA, Dec 2024).
- One- and two-family dwellings were 81 percent of those fires (USFA, Dec 2024).
- The fire spread beyond the room where it started in 93 percent of them (USFA, Dec 2024).
- Sixty percent had a person asleep as the leading human factor (USFA, Dec 2024).
How Much Do Home Fires Cost?
The bill is large and still climbing after inflation. A structure fire costs more now than it did in 1980, even in constant dollars.
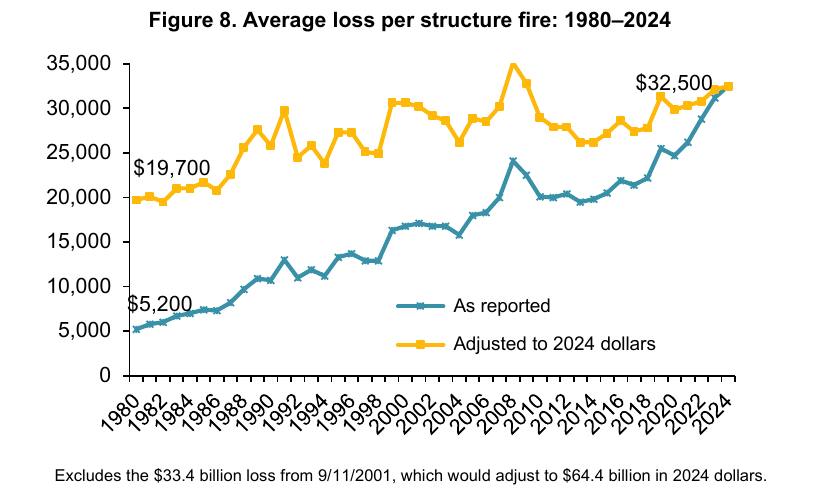
How much property damage do home fires cause each year?
- Home fires caused 62 percent of all US direct fire property damage in 2024 (NFPA, Nov 2025).
- One- and two-family homes alone caused $9.4 billion of that damage (NFPA, Nov 2025).
- USFA put residential building fire loss at $11.27 billion in 2023 (USFA, Feb 2025).
- Adjusted for inflation, that loss grew 25 percent from 2014 to 2023 (USFA, Feb 2025).
- CPSC staff estimated $7.70 billion in property loss a year from unintentional residential fires from 2019 to 2021 (CPSC, Jul 2024).
What does a single structure fire cost on average?
- The average loss per structure fire was $32,500 in 2024, in 2024 dollars (NFPA, Nov 2025).
- The 1980 equivalent was $19,700 (NFPA, Nov 2025).
- Structure fires were 82 percent of total fire losses in Maine in 2024 (Maine State Fire Marshal, Dec 2025).
What do state fire marshals report for dollar loss?
- Minnesota residential structure fires caused $192.3 million in loss in 2024 (Minnesota State Fire Marshal, Mar 2026).
- Minnesota fire loss from all fires ran at $1,276,272 a day (Minnesota State Fire Marshal, Mar 2026).
Home Fire Statistics by State: Which States Fare Worst?
State rankings are easy to misread. A state that counts more small fires reports a lower death rate per fire, so use the figures below as reporting-based signals, not a safety league table.
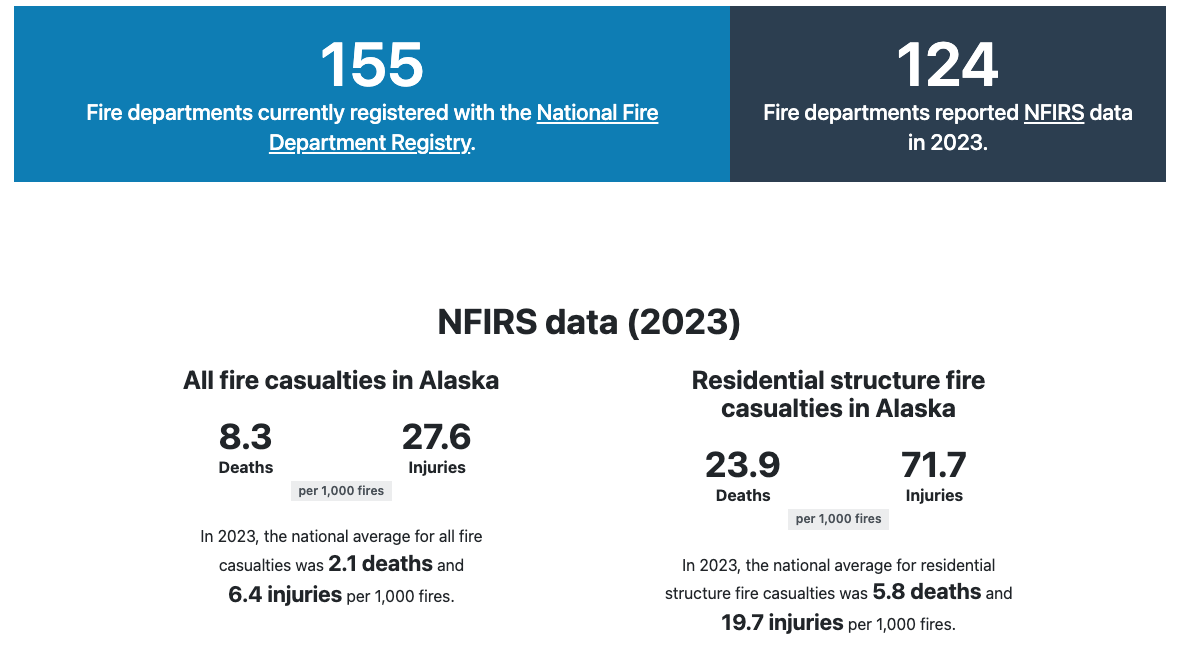
Which states report the highest and lowest death rates per fire?
- The national average was 5.8 deaths and 19.7 injuries per 1,000 residential structure fires in 2023 (USFA, Mar 2025).
- West Virginia reported 15.8 deaths per 1,000 residential structure fires (USFA, Mar 2025).
- Hawaii reported 14.1, based on NFIRS data from four fire departments (USFA, Mar 2025).
- Tennessee reported 14.0 (USFA, Mar 2025).
- Ohio reported 8.4 (USFA, Mar 2025).
- Texas reported 4.7 (USFA, Mar 2025).
- California reported 3.5 (USFA, Mar 2025).
- New York reported 1.1 (USFA, Mar 2025).
- Nebraska reported 0.9 (USFA, Mar 2025).
How complete is state fire data?
- Texas had 946 fire departments report NFIRS data for 2023 (USFA, Mar 2025).
- Alaska had 124 departments report, out of 155 currently in the national registry (USFA, Mar 2025).
- Minnesota’s 2024 report covers 698 of the state’s 770 fire departments (Minnesota State Fire Marshal, Mar 2026).
What do state fire marshal reports show for 2024?
- Minnesota counted 4,754 residential structure fires in 2024 (Minnesota State Fire Marshal, Mar 2026).
- Over five years, Minnesota saw one residential structure fire for every 1,163 residents each year (Minnesota State Fire Marshal, Mar 2026).
- Residential fires injured 203 civilians in Minnesota in 2024 (Minnesota State Fire Marshal, Mar 2026).
- Maine investigated 15 fires that killed 16 people in 2024, a rate of 1.16 per 100,000 (Maine State Fire Marshal, Dec 2025).
- That was down from 29 deaths and 2.13 per 100,000 in 2023 (Maine State Fire Marshal, Dec 2025).
- The median age of the people who died in Maine fires in 2024 was 63 (Maine State Fire Marshal, Dec 2025).
When Do Home Fires Start?
Home fires peak when people are awake and cooking, but they kill when people are asleep. The hour with the most fires is not the hour with the most deaths.
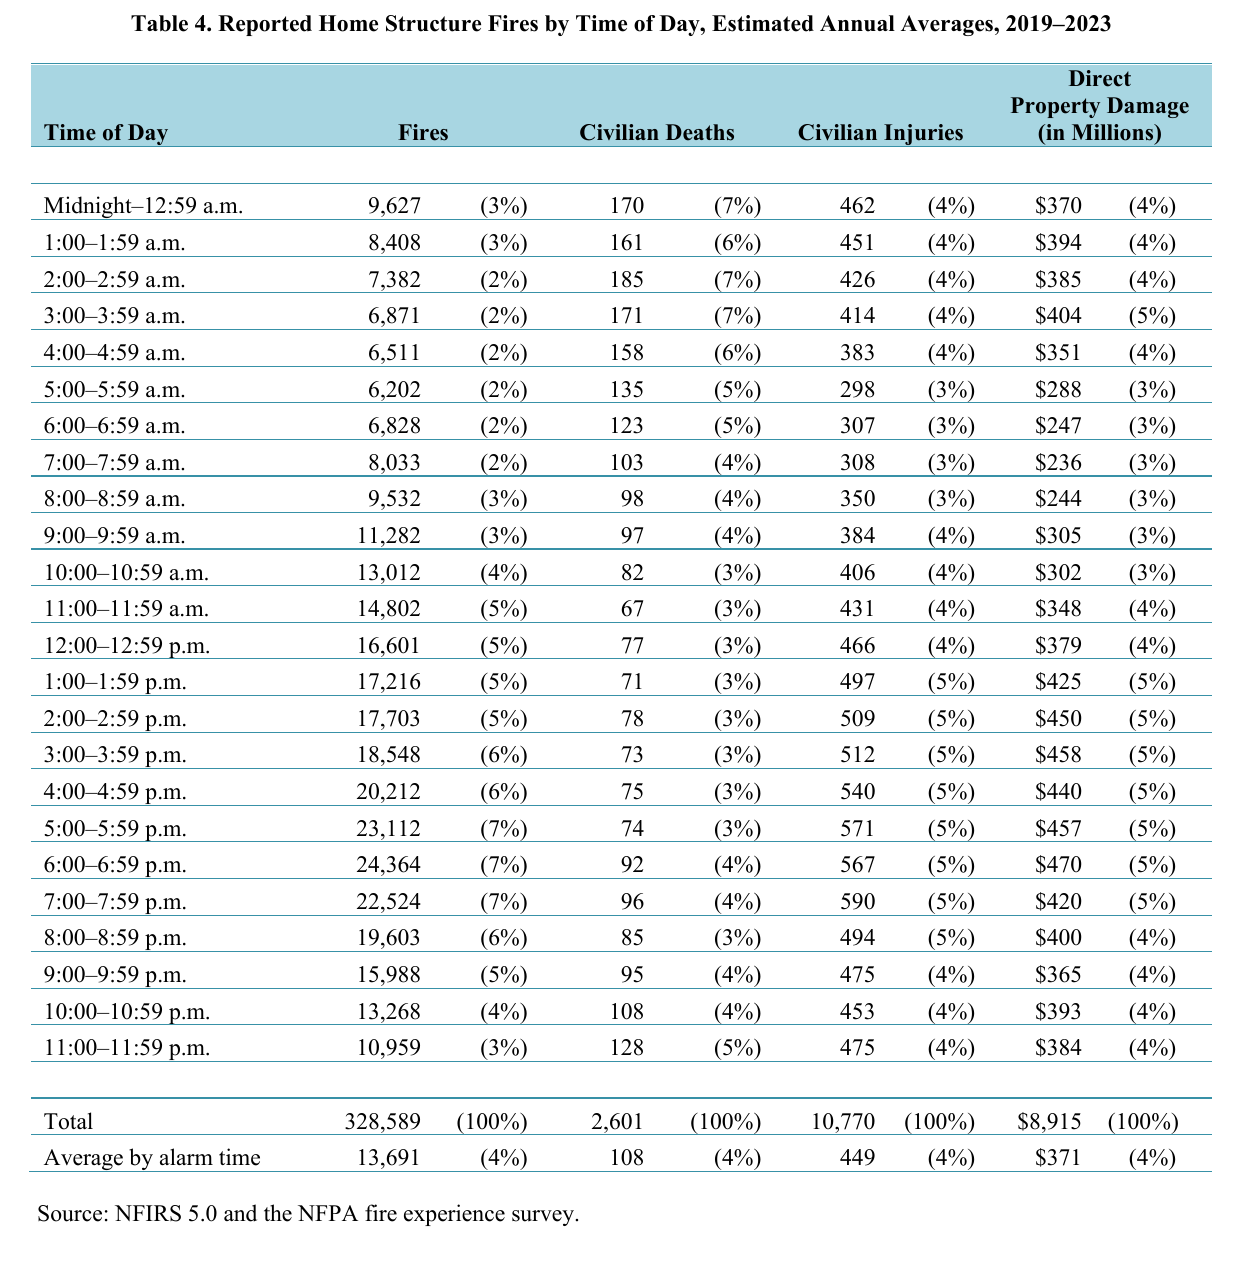
What time of day are home fires most common and most deadly?
- Reported home fires peaked from 5:00 to 8:00 p.m. (NFPA, Aug 2025).
- The 7:00 to 7:59 p.m. hour had the most injuries, at 590 a year (NFPA, Aug 2025).
- The 11 p.m. to 7 a.m. window held 45 percent of fatal fires in residential buildings from 2018 to 2020 (USFA, Jun 2022).
- The single worst hour for fatal fires was midnight to 1 a.m., at 7 percent (USFA, Jun 2022).
- Midnight to 6 a.m. held 53 percent of multiple-fatality fires (USFA, Dec 2024).
Which months and days have the most home fires?
- January had 323 home fire deaths a year, against 133 in August (NFPA, Aug 2025).
- January was the busiest month, with 31,701 home fires a year (NFPA, Aug 2025).
- September was the quietest month, with 22,344 (NFPA, Aug 2025).
- Fatal fires in residential buildings peaked in January at 14 percent of the year (USFA, Jun 2022).
What are people doing when a fatal home fire starts?
- Being asleep was the leading human factor in 41 percent of fatal residential fires (USFA, Jun 2022).
- Fatal fires most often began in bedrooms, at 27 percent (USFA, Jun 2022).
- Common areas such as living and family rooms followed, at 26 percent (USFA, Jun 2022).
Do Smoke Alarms Cut Home Fire Deaths?
Nearly every home has an alarm. The gap is in alarms that work, and the death data show what that gap costs.
How many homes have working smoke alarms?
- About 99 percent of households have a smoke alarm installed, up from 88 percent in the 1994 survey (CPSC, Sep 2024).
- Only 55 percent of households have a carbon monoxide alarm (CPSC, Sep 2024).
- Nine percent of the alarms tested did not work even after power was restored (CPSC, Sep 2024).
- Another 13 percent failed at first because of a missing or old battery, then worked once fixed (CPSC, Sep 2024).
- One third of households with smoke alarms never test them (CPSC, Sep 2024).
- Only 51 percent of heads of household always named the correct age range of their alarms (CPSC, Sep 2024).
- The 2004 and 2005 federal survey found only 31 percent of households had an alarm in every bedroom (CPSC, Jul 2009).
- A NIST page estimates that about 20 percent of homes with smoke alarms have alarms that do not work (NIST, Sep 2025).
- A NIST economist estimated that actual smoke alarm use is likely below 92 percent, because phone surveys miss homes without phones (NIST, Nov 2018).
How much do working alarms reduce deaths?
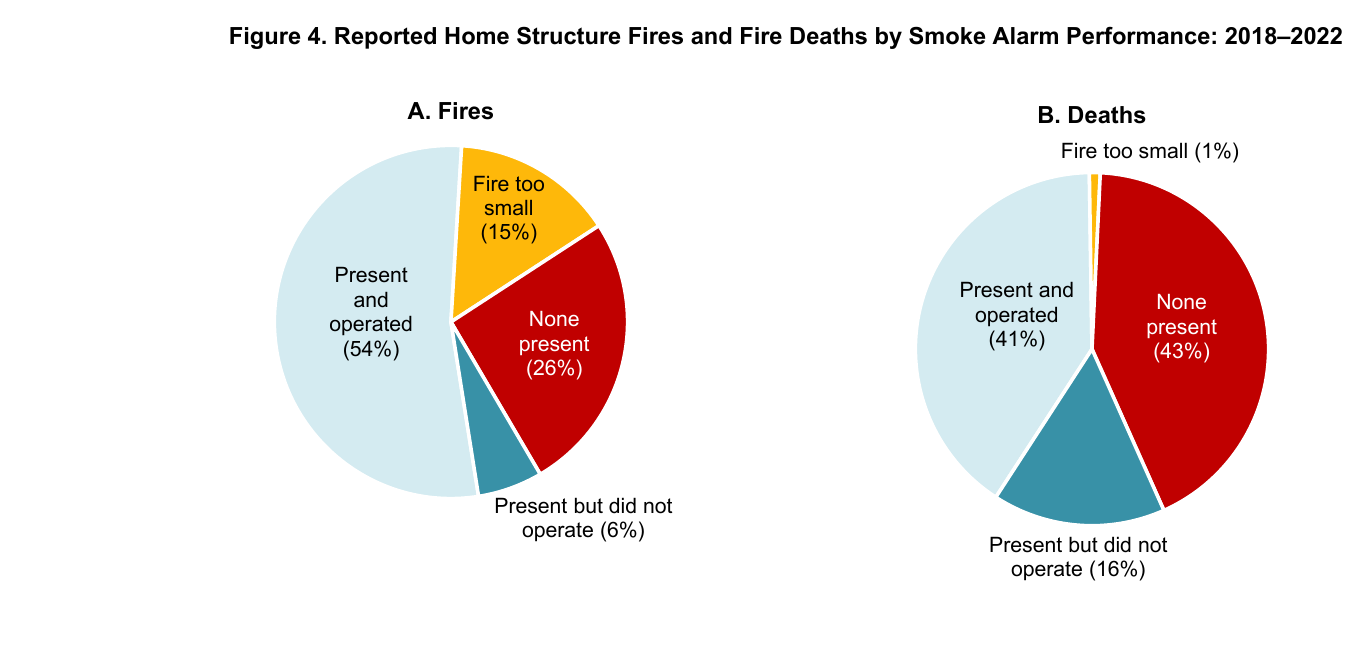
- Smoke alarms were present in 74 percent of reported home fires from 2018 to 2022 (NFPA, Jun 2024).
- The death rate per 1,000 fires was about 60 percent lower in homes with working alarms (NFPA, Jun 2024).
- That meant 5.8 deaths per 1,000 fires with a working alarm, against 14.4 with none or none that worked (NFPA, Jun 2024).
- When present, alarms operated in 90 percent of fires large enough to set them off (NFPA, Jun 2024).
- Of the deaths in homes with working alarms, 28 percent occurred when the alarm failed to alert people (NFPA, Jun 2024).
- Another 9 percent occurred when people were alerted but did not respond (NFPA, Jun 2024).
- Smoke alarms were missing in 24 percent of fatal fires in occupied residential buildings from 2018 to 2020 (USFA, Jun 2022).
- Minnesota fire departments documented alarms in only 18 percent of 4,754 residential fires, and 96 percent of the alarms present operated (Minnesota State Fire Marshal, Mar 2026).
Do hardwired and battery alarms perform the same?
- Hardwired alarms operated in 94 percent of fires large enough to trigger them (NFPA, Jun 2024).
- Battery-only alarms operated 85 percent of the time (NFPA, Jun 2024).
- Sixty-six percent of fatal injuries in homes with alarms were in homes with battery-only alarms (NFPA, Jun 2024).
- The death rate was 71 percent lower with hardwired alarms with a battery than with no alarm and no sprinklers (NFPA, Jun 2024).
- Alarms failed to operate in an estimated 19,119 home fires a year when they should have, causing 403 deaths (NFPA, Jun 2024).
- In Minnesota, 50 percent of smoke alarm failures came from a missing or disconnected battery (Minnesota State Fire Marshal, Mar 2026).
Adding hardwired alarms or other loads to a home means checking wire size and circuit load before the work starts.
How many lives have free alarm programs saved?
- The American Red Cross said its Home Fire Campaign had saved at least 1,583 lives since October 2014 (American Red Cross, Feb 2023).
- It reached its goal of installing 2.5 million free smoke alarms (American Red Cross, Feb 2023).
- The Red Cross reported that home fires claim seven lives every day in the US (American Red Cross, Feb 2023).
How Well Do Home Fire Sprinklers Work?
Sprinklers show a large effect in the data, and they are missing from most fatal fires.
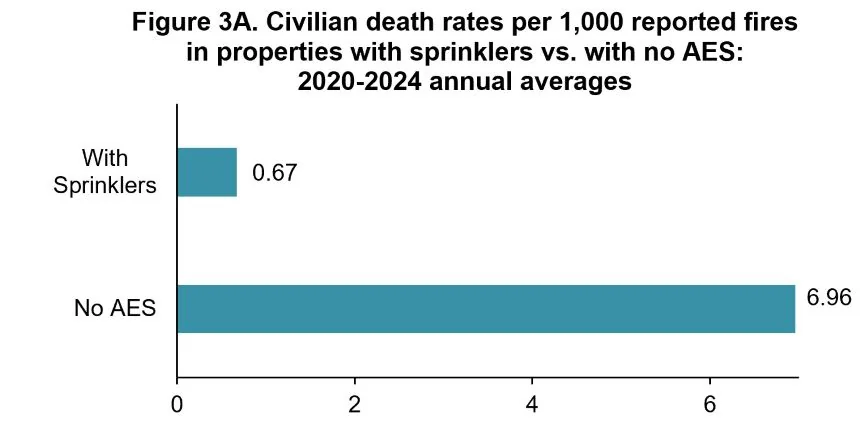
What do home fires with sprinklers look like?
- Fires in homes with sprinklers cost $333 million a year in direct property damage, 4 percent of the home fire total (NFPA, Oct 2026).
- Home fires with sprinklers present caused 25 civilian deaths a year, 1 percent of all home fire deaths (NFPA, Oct 2026).
- Automatic extinguishing systems, including residential sprinklers, were missing in 90 percent of fatal fires in occupied residential buildings (USFA, Jun 2022).
- They were missing in 91 percent of multiple-fatality fires (USFA, Dec 2024).
- They were present in only 5 percent of nonconfined fires in occupied residential buildings from 2017 to 2019 (USFA, May 2021).
How well do sprinklers perform in a fire?
- Across all structure fires, sprinklers operated and were effective in 87 percent of the fires large enough to activate them (NFPA, Oct 2026).
- Where sprinklers operated in structure fires, they controlled the fire in 97 percent of incidents (NFPA, Oct 2026).
- Across all structure fires, the civilian injury rate was 37 percent lower with sprinklers (NFPA, Oct 2026).
- Fire spread stayed within the room or object of origin in 93 percent of sprinklered structure fires, against 68 percent with no system (NFPA, Oct 2026).
What do sprinklers cost and save?
- USFA says fire sprinklers and smoke alarms together reduce the risk of dying in a fire by 82 percent (USFA, Apr 2023).
- USFA puts the cost of a home sprinkler at about $1.35 per square foot in a new home (USFA, Apr 2023).
- USFA says a sprinkler system may lower insurance rates by 5 to 15 percent (USFA, Apr 2023).
- Minnesota fire departments logged 110 sprinkler saves in 2024, about one every three days (Minnesota State Fire Marshal, Mar 2026).
- The death rate was 90 percent lower with both a smoke alarm and an extinguishing system than with neither (NFPA, Jun 2024).
How Fast Does a Home Fire Spread?
A room full of modern furnishings can reach flashover in minutes. That leaves little time to get out.
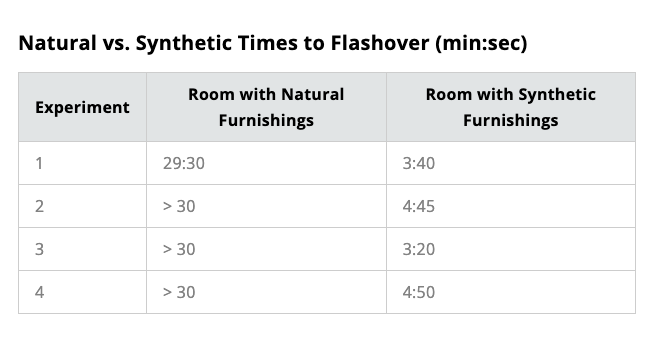
How many minutes until flashover?
- The fastest synthetic room reached flashover in 3 minutes 20 seconds (UL FSRI, Sep 2020).
- The first natural room took 29 minutes 30 seconds (UL FSRI, Sep 2020).
- USFA says today’s structure fires can go from a small flame to flashover in 3 to 5 minutes (USFA, Apr 2024).
- USFA adds that a lithium-ion battery can go from first smoke to thermal runaway in as little as 15 seconds (USFA, Apr 2024).
- Residents could have less than 2 minutes to escape once the smoke alarm sounds (USFA, Apr 2025).
How often does the fire leave the room where it started?
- In 50 percent of nonconfined residential building fires, the fire extended beyond the room of origin (USFA, May 2021).
- Ninety-three percent of residential building cooking fires were small, confined fires that stayed where they began (USFA, May 2021).
- One of every 12 fires that began with upholstered furniture killed someone (NFPA, Aug 2025).
- One of every 25 fires that began with a mattress or bedding was fatal (NFPA, Aug 2025).
Who Responds to Home Fires, and How Fast?
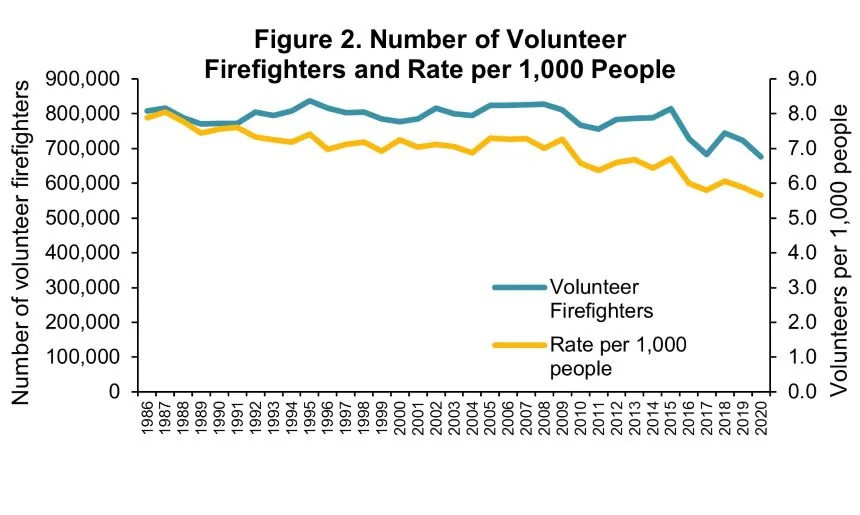
Fire departments spend little of their time on fires, and most of the people staffing them are volunteers. Response time is a local number, so this page uses a state report for it.
How many fire departments and firefighters respond to home fires?
- There were 29,452 fire departments in the US in 2020 (NFPA, Sep 2022).
- An estimated 1,041,200 career and volunteer firefighters served them (NFPA, Sep 2022).
- Volunteers were 65 percent of firefighters (NFPA, Sep 2022).
- All-career or mostly-career departments were 18 percent of departments but protected 70 percent of the population (NFPA, Sep 2022).
- Thirty-seven percent of departments provided no emergency medical services (NFPA, Sep 2022).
What share of fire department calls are fires?
- Fires were 3.7 percent of fire department responses in 2024 (USFA, Jul 2026).
- EMS and rescue calls were 65.1 percent (USFA, Jul 2026).
- Minnesota logged one structure fire every hour and 21 minutes in 2024 (Minnesota State Fire Marshal, Mar 2026).
- The Red Cross said home fires account for most of the more than 60,000 disasters it responds to each year (American Red Cross, Feb 2023).
How long does a fire department take to arrive?
Maine’s fire marshal publishes average response times for structure fires.
- Across 942 Maine structure fires in 2024, the average response time was 7.71 minutes (Maine State Fire Marshal, Dec 2025).
- It was 7.07 minutes where detectors were present (Maine State Fire Marshal, Dec 2025).
- It was 8.06 minutes where no detector was present (Maine State Fire Marshal, Dec 2025).
Glossary
- AES: automatic extinguishing system, which includes sprinklers.
- CPSC: the U.S. Consumer Product Safety Commission.
- CO: carbon monoxide.
- Flashover: the point where a room’s contents ignite almost at once as heat builds.
- NFIRS: the National Fire Incident Reporting System, the USFA database of incidents that fire departments report.
- NFPA: the National Fire Protection Association.
- NIST: the National Institute of Standards and Technology.
- UL FSRI: UL’s Fire Safety Research Institute.
- USFA: the U.S. Fire Administration, part of FEMA.
Methodology and Sources
Every figure comes from the agency, institute or state office that produced it, and each URL was opened and checked against the number it supports. The Minnesota and Maine reports were read from web archive copies of the state files, because the state servers block automated requests. National counts mix two methods: NFPA scales a survey of fire departments, while USFA scales NFIRS incident data, so the two never match exactly. State annual reports carry no posting month, so each is dated to the month its file was last modified. This page is reviewed monthly, and the newest full-year estimates are for 2024.
Sources
- NFPA, Fire Loss in the United States During 2024, Nov 2025
- USFA, Fatal Fires in Residential Buildings (2018 to 2020), Jun 2022
- NFPA, Smoke Alarms in US Home Fires, Jun 2024
- NFPA, US Experience with Sprinklers, Oct 2026
- UL FSRI, Comparison of Natural and Synthetic Home Furnishings, Sep 2020
- CPSC, Survey on Use and Functionality of Smoke and Carbon Monoxide Alarms in Households, Sep 2024
- USFA, Fire Death and Injury Risk, Apr 2025
- USFA, Alaska Fire Loss and Fire Department Profile, Mar 2025
- USFA, Multiple-Fatality Fires in Residential Buildings (2021 to 2023), Dec 2024
- CPSC, 2004-2005 National Sample Survey of Unreported Residential Fires, Jul 2009
- USFA, Statistics, Jul 2026
- USFA, Residential Fire Estimate Summaries (2014 to 2023), Feb 2025
- CPSC, 2019-2021 Residential Fire Loss Estimates, Jul 2024
- NFPA, Home Structure Fires and supporting tables, Aug 2025
- USFA, Fire Risk in 2022, Nov 2024
- Maine State Fire Marshal, Annual Operations and State Incident Report 2024, Dec 2025
- Minnesota State Fire Marshal, Fire in Minnesota 2024, Mar 2026
- USFA, West Virginia Fire Loss and Fire Department Profile, Mar 2025
- USFA, Hawaii Fire Loss and Fire Department Profile, Mar 2025
- USFA, Tennessee Fire Loss and Fire Department Profile, Mar 2025
- USFA, Ohio Fire Loss and Fire Department Profile, Mar 2025
- USFA, Texas Fire Loss and Fire Department Profile, Mar 2025
- USFA, California Fire Loss and Fire Department Profile, Mar 2025
- USFA, New York Fire Loss and Fire Department Profile, Mar 2025
- USFA, Nebraska Fire Loss and Fire Department Profile, Mar 2025
- NIST, Smoke Alarm Research, Sep 2025
- NIST, Estimating Smoke Alarm Effectiveness and Spatial Distribution in Homes (TN 2020), Nov 2018
- American Red Cross, Home Fire Campaign reaches goal of installing 2.5 million free smoke alarms, Feb 2023
- USFA, Residential Building Fires (2017 to 2019), May 2021
- USFA, Home Fire Sprinklers, Apr 2023
- USFA, Fire is Fast and Getting Faster, Apr 2024
- USFA, Home Fire Escape Plans, Apr 2025
- NFPA, US Fire Department Profile 2020, Sep 2022
Cite this page
Every figure links to the source that published it. Quote one with a link to this page or to the source.
WireGaugeCalc. "143 House Fire Statistics October 2026." WireGaugeCalc, October 2026. https://www.wiregaugecalc.com/statistics/house-fire-statistics/ <a href="https://www.wiregaugecalc.com/statistics/house-fire-statistics/">House Fire Statistics</a> (WireGaugeCalc, October 2026)