 WireGaugeCalc
169 Struck by Lightning Statistics October 2026
On this page
- How many people does lightning kill in the US each year?
- What are the odds of being struck by lightning?
- Who is most likely to die from lightning?
- Which states have the most lightning deaths and strikes?
- When do lightning deaths happen?
- What activities and places carry the most lightning risk?
- How many people does lightning injure, and what happens to survivors?
- How much lightning hits the US and the world?
- How many fires does lightning start?
- How much do lightning claims cost homeowners?
- How deadly is lightning around the world?
- Methodology and Sources
- Glossary
- Sources
Struck by lightning statistics point to a hazard that is rare for any one person and still costly for the country. Lightning kills about twenty people a year in the US, hurts hundreds more, starts thousands of wildfires and drives more than a billion dollars a year in homeowner claims.
This page collects the primary data behind those facts. Every number comes from the agency, lab or insurer that produced it, and every figure is dated. Death counts come from NOAA’s National Weather Service and the National Lightning Safety Council. Strike counts come from Vaisala Xweather. Claims come from Triple-I and State Farm.
The numbers matter to electricians because lightning reaches people and equipment through the same paths: wiring, plumbing and the ground. The sections on surges and grounding are written for people who work on services and panels.
Key Takeaways
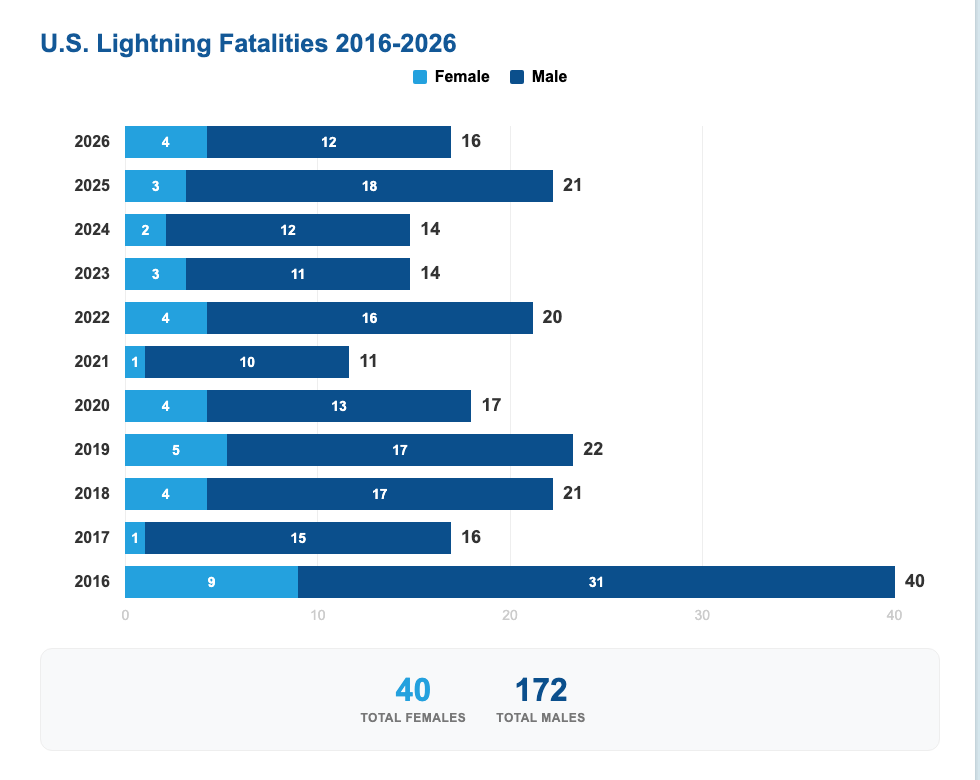
- Lightning killed 21 people in the US in 2025, and the 10-year average is 20 (NWS Lightning Fatalities, Sep 2026).
- The lifetime odds of being struck are about 1 in 15,300 (NWS Lightning Odds, Oct 2026).
- CDC counts 517 lightning deaths in the US from 2006 through 2025 (CDC Lightning Strike Victim Data, Jul 2026).
- About 80% of lightning victims are male (NLSC Detailed Analysis 2006 to 2025, Mar 2026).
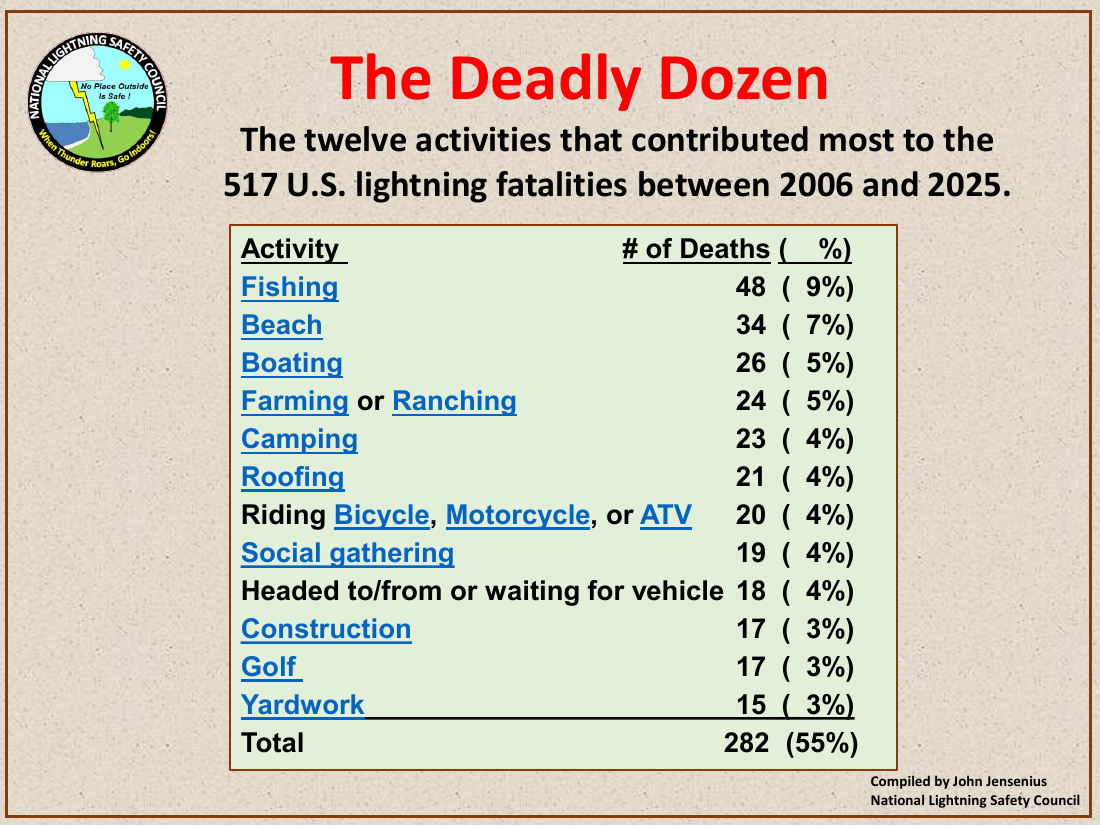
- Fishing is the deadliest activity, with 48 deaths from 2006 through 2025 (NLSC Deadly Dozen, Jan 2026).
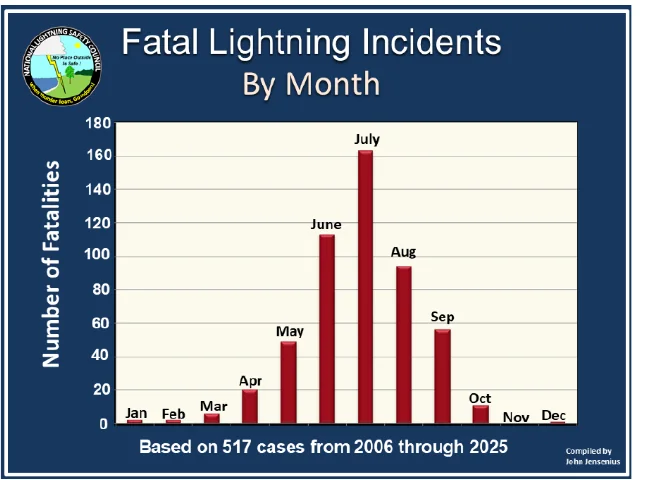
- July alone accounts for almost one third of lightning deaths (NLSC Detailed Analysis 2006 to 2025, Mar 2026).
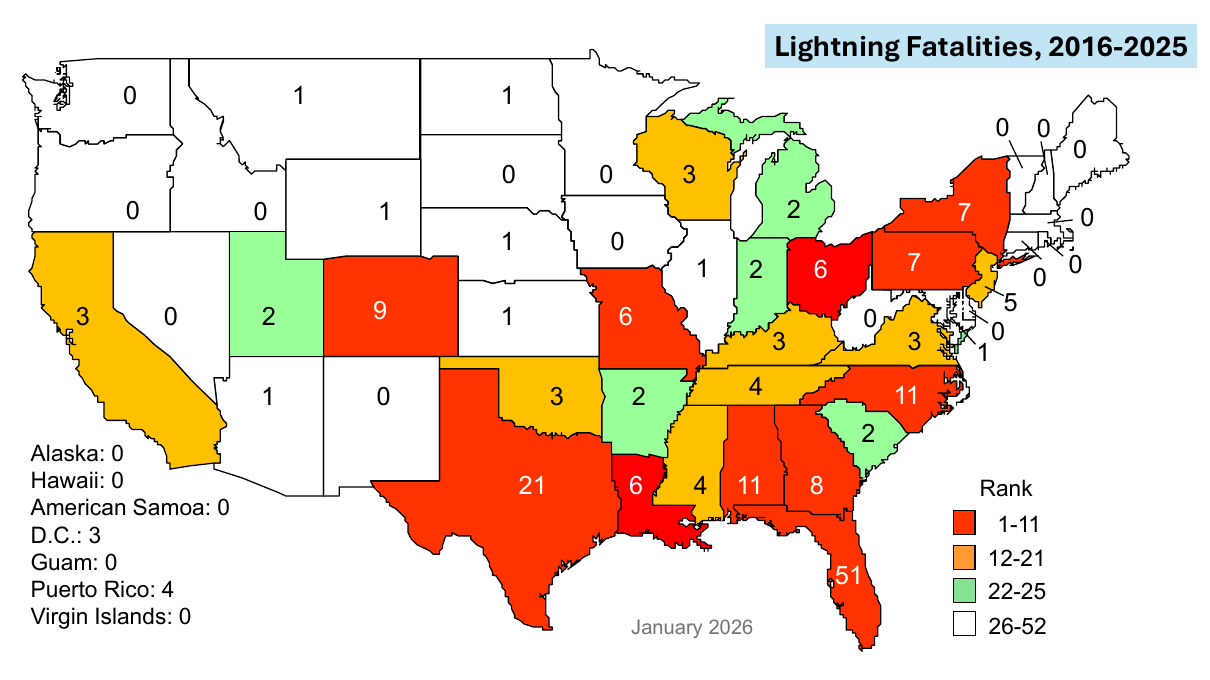
- Florida had 51 of the 196 US lightning deaths from 2016 through 2025 (NLSC Deaths by State 2016 to 2025, Jan 2026).
- The US recorded 252 million lightning events in 2025, up 20% from 2024 (Vaisala Xweather Press Release, Jan 2026).
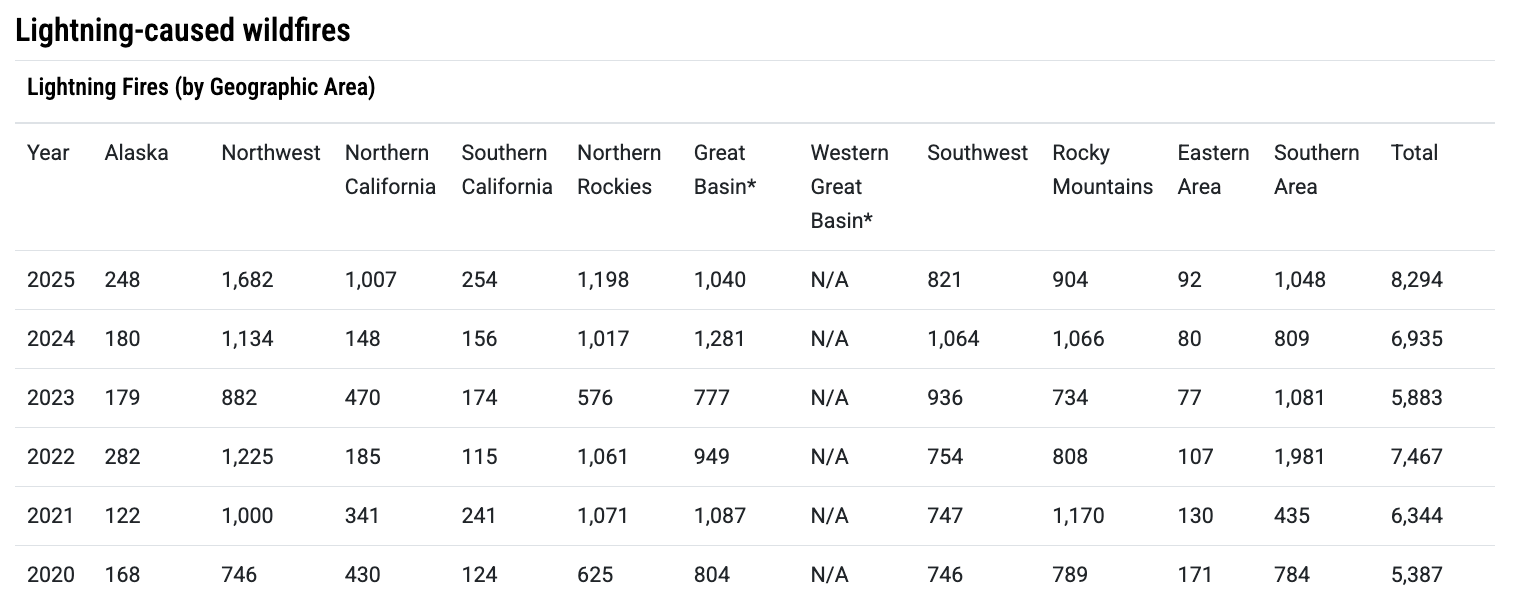
- Lightning started 8,294 US wildfires in 2025, and they burned 2,857,141 acres (NIFC Lightning-Caused Wildfires, Oct 2026).
- US insurers paid $1.65 billion on lightning homeowner claims in 2025, an average of $26,616 per claim (Triple-I Facts and Statistics: Lightning, Sep 2026).
- NWS lists 432 lightning deaths in 1943, the highest year since its list began in 1940 (NWS Weather Fatalities 1940 to 2025, Jul 2026).
- NASA cites about 24,000 lightning deaths and 240,000 injuries worldwide each year (NASA Earthdata Lightning, Oct 2026).
How many people does lightning kill in the US each year?
The count is small and it keeps falling. The long view is the real story: a hazard that once killed hundreds a year now kills about twenty.
How many people did lightning kill in recent years?
Counts since 2017 sit between 11 and 22 a year, with 2021 the lowest at 11 (NWS Lightning Fatalities, Sep 2026).
- 2016 was the worst year of the decade, with 40 deaths (NWS Lightning Fatalities, Sep 2026).
- 2023 and 2024 each recorded 14 deaths (NWS Lightning Fatalities, Sep 2026).
- The National Lightning Safety Council lists 17 deaths so far in 2026 (NLSC Lightning Deaths, Oct 2026).
- The council’s list starts in 2006 with 49 deaths, followed by 47 in 2007 (NLSC Lightning Deaths, Oct 2026).
- CDC puts the average at 26 deaths a year from 2006 through 2025 (CDC Lightning FAQ, Jul 2026).
How far have lightning deaths fallen over the long run?
NWS Storm Data shows 340 lightning deaths in 1940 and 20 in 2025 (NWS Weather Fatalities 1940 to 2025, Jul 2026).
- The 30-year average is 31 deaths a year and the 10-year average is 19 (NWS Weather Fatalities 1940 to 2025, Jul 2026).
- The list totals 9,499 lightning deaths from 1940 through 2025 (NWS Weather Fatalities 1940 to 2025, Jul 2026).
- Reported deaths averaged 43 a year from 1989 through 2018 (NWS Lightning Odds, Oct 2026).
- A peer-reviewed study of CDC data counts 87 deaths in 1979 and 100 in 1982, a rate of 4.32 per 10 million people (Natural Hazards, Lightning Mortality 1979 to 2023, Feb 2026).
- The same study puts the 2023 rate at 0.53 deaths per 10 million people (Natural Hazards, Lightning Mortality 1979 to 2023, Feb 2026).
- Vaisala’s lightning scientist says better detection has cut US lightning deaths by almost two thirds (Vaisala Xweather Press Release, Jan 2026).
How does lightning compare with other weather killers?
In 2025 lightning killed 20 people, against 100 for heat, 67 for tornadoes and 55 for rip currents (NWS Natural Hazard Statistics 2025, Jul 2026).
- Over 30 years, heat averages 180 deaths a year, floods 94, tornadoes 73 and lightning 31 (NWS Weather Fatalities 1940 to 2025, Jul 2026).
What are the odds of being struck by lightning?
The odds of being struck by lightning are long in any one year and short over a lifetime. They are also much better than the headline suggests for people who stay out of the open when thunder is near.

What are the odds of being struck in a year?
NWS puts the yearly odds at 1 in 1,222,000, based on averages for 2009 through 2018 (NWS Lightning Odds, Oct 2026).
- The odds of being affected by someone else’s strike are 1 in 1,530, counting 10 people affected for each person struck (NWS Lightning Odds, Oct 2026).
- CDC says the yearly odds are less than one in a million (CDC Lightning Strike Victim Data, Jul 2026).
- The record is seven strikes in one lifetime (CDC Lightning Strike Victim Data, Jul 2026).
How many people survive a strike?
Almost 90% of lightning victims survive (CDC Lightning Strike Victim Data, Jul 2026).
- About 10% of victims die, most often from cardiac arrest (CDC Lightning FAQ, Jul 2026).
- NWS says the other 90% are left with various degrees of disability (NWS Lightning Odds, Oct 2026).
- A search of Colorado medical records found about 10 injuries for every death (Holle, Documented Global Lightning Fatalities, Apr 2016).
Who is most likely to die from lightning?
Lightning deaths are not spread evenly. They fall on men, on people in their teens to fifties, and on people who spend time outdoors.
Do more men or women die from lightning?
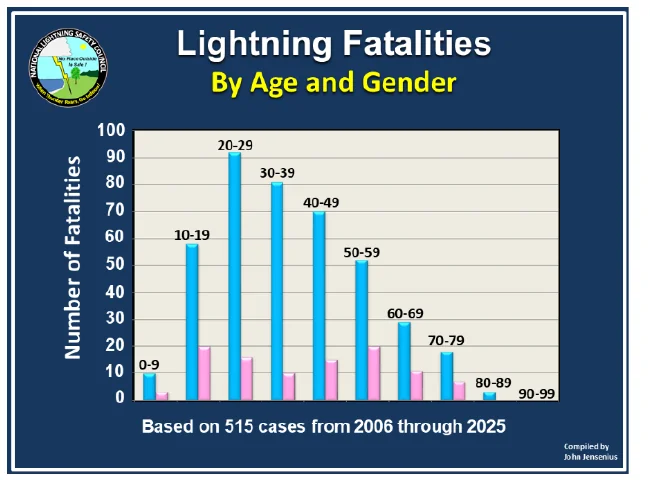
Men account for 415 of the 517 deaths and women for 102 (NLSC Detailed Analysis 2006 to 2025, Mar 2026).
- CDC says men are four times as likely as women to be struck (CDC Lightning Strike Victim Data, Jul 2026).
- The male share ranged from 62% in 2015 to 94% in 2017 (NLSC Detailed Analysis 2006 to 2025, Mar 2026).
- The male death rate fell from 5.610 to 1.081 per 10 million people between 1979 to 1998 and 2018 to 2023 (Natural Hazards, Lightning Mortality 1979 to 2023, Feb 2026).
- The female rate fell from 0.913 to 0.199 per 10 million over the same periods (Natural Hazards, Lightning Mortality 1979 to 2023, Feb 2026).
What ages are most at risk?
The average age of a person struck is 37 (CDC Lightning Strike Victim Data, Jul 2026).
- Most deaths fall between ages 10 and 60, with a small dip for women in their 30s (NLSC Detailed Analysis 2006 to 2025, Mar 2026).
- In 2018 to 2023, people aged 25 to 44 had higher death rates than people aged 15 to 24, reversing the 1979 to 1998 pattern (Natural Hazards, Lightning Mortality 1979 to 2023, Feb 2026).
Where do women face the most risk?
Women make up 34% of deaths in routine daily activities, one of their highest shares (NLSC Detailed Analysis 2006 to 2025, Mar 2026).
- Women are 27% of boating deaths (NLSC Detailed Analysis 2006 to 2025, Mar 2026).
Which states have the most lightning deaths and strikes?
Geography changes the answer depending on what you count. Florida leads on deaths, Texas on raw strike counts and the Gulf states on strike density.
Which states had the most lightning deaths from 2016 to 2025?
Texas ranks second with 21 deaths (NLSC Deaths by State 2016 to 2025, Jan 2026).
- Alabama and North Carolina follow with 11 each, then Colorado with 9 and Georgia with 8 (NLSC Deaths by State 2016 to 2025, Jan 2026).
- New York and Pennsylvania record 7 each (NLSC Deaths by State 2016 to 2025, Jan 2026).
- Five states, plus the US Virgin Islands and the Northern Mariana Islands, have reported no lightning deaths since 2006 (CDC Lightning Strike Victim Data, Jul 2026).
- Florida has recorded more than 2,000 lightning injuries in the past 50 years (CDC Lightning Strike Victim Data, Jul 2026).
Which states have the highest lightning death rates per person?
Washington, D.C. leads at 0.43 deaths per million people a year for 2016 to 2025, followed by Florida at 0.24 (NLSC Weighted Deaths by State, Jan 2026).
- Alabama is third at 0.22, and Wyoming is fourth at 0.17 (NLSC Weighted Deaths by State, Jan 2026).
- Over the longer 1959 to 2017 span, Florida recorded 498 of the nation’s 4,136 deaths (Holle, Lightning Deaths by State 1959 to 2017, May 2018).
- Over that span Wyoming had the top per-person rate at 1.19 deaths per million, and New Mexico was second at 1.12 (Holle, Lightning Deaths by State 1959 to 2017, May 2018).
- The US South accounts for slightly more than half of all US lightning deaths (Natural Hazards, Lightning Mortality 1979 to 2023, Feb 2026).
Which states get the most lightning?
Texas recorded 47,361,143 total lightning events in 2025, more than Florida and Oklahoma combined (Xweather Annual Lightning Report 2025, Jan 2026).
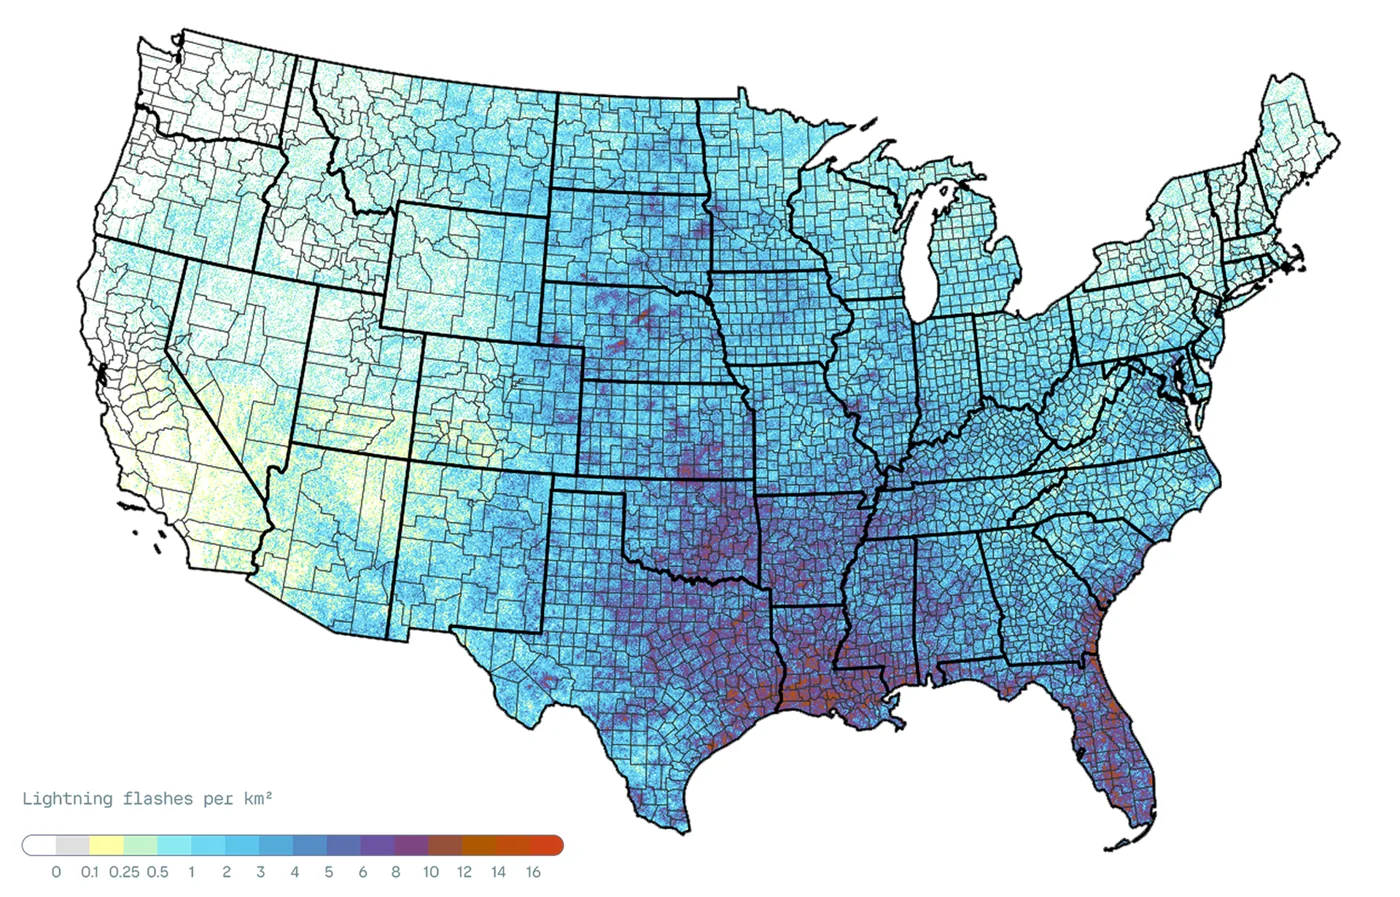
- By density, Florida led with 305 events per square mile, then Oklahoma at 253, Louisiana at 241, Mississippi at 231 and Arkansas at 230 (Vaisala Xweather Press Release, Jan 2026).
- The top 7 states hold more than 50% of US lightning (Xweather Annual Lightning Report 2025, Jan 2026).
- The bottom 14 states hold less than 1% (Xweather Annual Lightning Report 2025, Jan 2026).
- Shady Grove, Oklahoma was the 2025 lightning capital at 3,005 events per square mile (Vaisala Xweather Press Release, Jan 2026).
- Polk County, Florida saw the most events of any county, at 1,057,635 (Xweather Annual Lightning Report 2025, Jan 2026).
When do lightning deaths happen?
Lightning deaths follow people more than storms. They peak in summer, on weekends and in the afternoon, when the most people are outside.
Which months are deadliest?
June, July and August bring more than 72% of lightning deaths (NLSC Detailed Analysis 2006 to 2025, Mar 2026).
- In Canada, more than 90% of lightning deaths and 80% of injuries fall in those same three months (Environment and Climate Change Canada, Lightning Statistics, Jan 2021).
- July alone holds 36.1% of Canada’s lightning deaths in the media-report record (Environment and Climate Change Canada, Lightning Statistics, Jan 2021).
- July also holds 46.3% of Canada’s lightning injuries (Environment and Climate Change Canada, Lightning Statistics, Jan 2021).
Which days and hours are riskiest?
Two out of three lightning deaths occur between noon and 6 p.m. (CDC Lightning Strike Victim Data, Jul 2026).
- Deaths often occur on weekends, particularly Saturdays (CDC Lightning Strike Victim Data, Jul 2026).
When does US lightning peak?
The 2025 peak day was April 5, with 3,099,808 lightning events in 24 hours (Xweather Annual Lightning Report 2025, Jan 2026).
- That day’s 157 severe storms produced more events than the annual totals of the 14 least lightning-prone states combined (Vaisala Xweather Press Release, Jan 2026).
- Six days in January 2025 had no detected lightning in the lower 48 (Xweather Annual Lightning Report 2025, Jan 2026).
- On January 22, the only cloud-to-ground stroke in the lower 48 hit a radio tower in Tallahassee (Xweather Annual Lightning Report 2025, Jan 2026).
What activities and places carry the most lightning risk?
Golf gets the blame, but the data points to water, farms and work sites. People are usually hurt a few steps from shelter, not far from it.
What are the deadliest activities?
Beach activities rank second with 34 deaths, followed by boating with 26 (NLSC Deadly Dozen, Jan 2026).
- Farming or ranching caused 24 deaths, camping 23 and roofing 21 (NLSC Deadly Dozen, Jan 2026).
- Riding a bicycle, motorcycle or ATV caused 20 deaths and social gatherings 19 (NLSC Deadly Dozen, Jan 2026).
- Construction and golf each caused 17 deaths, and yardwork caused 15 (NLSC Deadly Dozen, Jan 2026).
- The twelve activities together account for 282 deaths, or 55% of the total (NLSC Deadly Dozen, Jan 2026).
- Fishermen accounted for three times as many deaths as golfers (NLSC Detailed Analysis 2006 to 2025, Mar 2026).
Are leisure, routine or work activities riskier?
Leisure activities caused 328 deaths, or 63% of the total (NLSC Detailed Analysis 2006 to 2025, Mar 2026).
- Work-related activities caused 100 deaths (19%) and daily routine activities 76 (15%) (NLSC Detailed Analysis 2006 to 2025, Mar 2026).
- Water-related activities make up 34% of leisure deaths and sports make up 14% (NLSC Detailed Analysis 2006 to 2025, Mar 2026).
- Within sports deaths, golf accounts for 36% and soccer for 31% (NLSC Detailed Analysis 2006 to 2025, Mar 2026).
Which jobs have the most lightning deaths?
Construction and farming are the two most common occupations among victims (CDC Lightning FAQ, Jul 2026).
- Farming and ranching make up 24% of work-related deaths and roofing makes up 21% (NLSC Detailed Analysis 2006 to 2025, Mar 2026).
- Construction makes up 17% of work-related deaths and lawn care 9% (NLSC Detailed Analysis 2006 to 2025, Mar 2026).
- About 91% of work-related lightning victims are male (NLSC Detailed Analysis 2006 to 2025, Mar 2026).
How are people struck, and where does the danger sit?
Ground current causes the most lightning deaths and injuries (NWS Five Ways Lightning Strikes People, Oct 2026).
- Standing under a tree is the second leading cause of lightning casualties (NWS Lightning Myths, Oct 2026).
- Conduction through wires and plumbing causes most indoor lightning casualties (NWS Five Ways Lightning Strikes People, Oct 2026).
- Lightning can strike more than three miles from the center of a storm, and bolts from the blue can land 10 to 15 miles away (NWS Lightning Myths, Oct 2026).
- The Empire State Building is hit an average of 23 times a year (NWS Lightning Myths, Oct 2026).
How often does lightning stop stadium events?
Lightning caused 11 confirmed delays at NFL and NCAA football games in 2025 (Vaisala Xweather Press Release, Jan 2026).
- At Ross-Ade Stadium on September 13, 1,800 lightning events within 10 miles forced a full evacuation and a 90-minute delay (Vaisala Xweather Press Release, Jan 2026).
- Hard Rock Stadium logged 324 hours of lightning warning time in 2025, assuming a 10-mile radius and a 30-minute hold (Xweather Annual Lightning Report 2025, Jan 2026).
How many people does lightning injure, and what happens to survivors?
Injury counts are soft because no one tracks them well. The official numbers are a floor, and survivors often carry problems that no scan shows.
How many lightning injuries are reported each year?
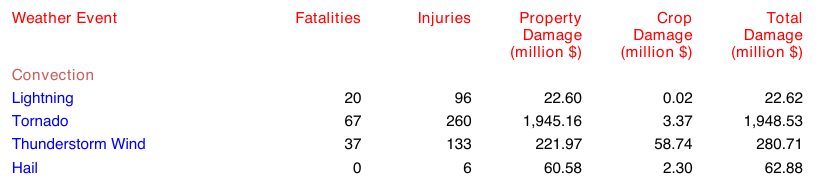
NWS recorded 96 lightning injuries in 2025 (NWS Natural Hazard Statistics 2025, Jul 2026).
- The 2024 count was 41 (NWS Natural Hazard Statistics 2024, Mar 2026).
- The 2023 count was 56 (NWS Natural Hazard Statistics 2023, Dec 2024).
- The 2019 count was 100 (NWS Natural Hazard Statistics 2019, Sep 2021).
- The 2016 count was 120 (NWS Natural Hazard Statistics 2016, May 2017).
- CDC says lightning injuries are not well documented and estimates hundreds a year (CDC Lightning FAQ, Jul 2026).
- In Canada, estimated injuries peaked at 347 in 2012 (Environment and Climate Change Canada, Lightning Statistics, Jan 2021).
What injuries do survivors have?
Lightning is mainly an injury to the nervous system, and serious burns are rare (NWS Medical Aspects of Lightning, Oct 2026).
- X-ray, CT and MRI results often come back normal in survivors, because the injury is in how the brain works (NWS Medical Aspects of Lightning, Oct 2026).
- CDC lists blunt trauma, permanent neurological syndromes, muscle and eye injuries, cataracts, skin lesions and burns among the harms (CDC Lightning FAQ, Jul 2026).
- A support group for survivors has operated since 1989 (NWS Medical Aspects of Lightning, Oct 2026).
How much property damage does Storm Data record?
Storm Data recorded $22.6 million in lightning property damage in 2025 (NWS Natural Hazard Statistics 2025, Jul 2026).
- The 2019 total was $41.15 million (NWS Natural Hazard Statistics 2019, Sep 2021).
- The 2023 total was $29.89 million (NWS Natural Hazard Statistics 2023, Dec 2024).
How much lightning hits the US and the world?
Lightning is far more common than its death toll suggests. Most of it never touches a person, and that is part of why the risk feels abstract.
How many lightning flashes hit the US each year?
NWS says the US has about 25 million lightning flashes a year (NWS Lightning Science, Oct 2026).
- CDC says about 37 million lightning strikes hit the ground in the US each year (CDC Lightning Strike Victim Data, Jul 2026).
- Vaisala Xweather counted over 2 billion lightning events worldwide in 2025, a 7% decrease from 2024 (Vaisala Xweather Press Release, Jan 2026).
- The Vaisala count includes both cloud-to-cloud and cloud-to-ground events (Vaisala Xweather Press Release, Jan 2026).
How much lightning strikes the planet?
About 6,000 lightning strikes occur worldwide every minute, more than 8 million a day (CDC Lightning and Your Safety, Jul 2026).
- NASA puts the global rate between 35 flashes per second in Northern Hemisphere winter and 55 in summer (NASA Earthdata Lightning, Oct 2026).
- A satellite climatology gives a mean global rate of 46 flashes per second (Albrecht et al., Bulletin of the American Meteorological Society, Nov 2016).
- More than 2,000 thunderstorms are active worldwide at any moment (NASA Earthdata Lightning, Oct 2026).
- Cloud-to-ground lightning makes up only about 25% of all lightning (NASA Earthdata Lightning, Oct 2026).
- Lightning can heat the air it passes through to 50,000 degrees Fahrenheit (NWS Lightning Science, Oct 2026).
Where is lightning most intense on Earth?
Lake Maracaibo in Venezuela is the top-ranked lightning hotspot on Earth (Albrecht et al., Bulletin of the American Meteorological Society, Nov 2016).
- NASA puts its density at 250 flashes per square kilometer per year (NASA Earthdata Maracaibo Beacon, Apr 2021).
- The storms recur on about 300 days a year (NASA Earthdata Maracaibo Beacon, Apr 2021).
- Lightning hits the lake about 28 times a minute for up to nine hours (NASA Earthdata Maracaibo Beacon, Apr 2021).
- The eastern Congo basin peaks at 160 flashes per square kilometer per year in an earlier climatology (Albrecht et al., Bulletin of the American Meteorological Society, Nov 2016).
Is lightning increasing with warming?
Models project about 12% more US cloud-to-ground lightning for each degree Celsius of warming (UC Berkeley News, Lightning Expected to Increase, Nov 2014).
- That adds up to roughly a 50% increase by 2100 under business-as-usual emissions (UC Berkeley News, Lightning Expected to Increase, Nov 2014).
- Precipitation and storm buoyancy together predicted 77% of the variation in lightning strikes (UC Berkeley News, Lightning Expected to Increase, Nov 2014).
- A 2025 study projects 4 to 12 more cloud-to-ground lightning days by 2031 to 2060 in many northern western grid cells (Earth’s Future, Lightning-Ignited Wildfire Risk, Aug 2025).
How many fires does lightning start?
Lightning starts a small share of wildfires by count and a large share by acres. It also lights fires in remote places where crews arrive late.
How many wildfires does lightning start each year?
Lightning fires peaked at 16,165 in 2006, the highest count since NIFC began tracking cause in 2001 (NIFC Lightning-Caused Wildfires, Oct 2026).
- All causes together produced 77,850 US wildfires in 2025 (NIFC Wildfires and Acres, Oct 2026).
- Those fires burned 5,131,474 acres in total (NIFC Wildfires and Acres, Oct 2026).
- In 2024 lightning started 6,935 fires that burned 4,258,331 acres (NIFC Lightning-Caused Wildfires, Oct 2026).
- In 2023 lightning fires burned 1,160,665 acres (NIFC Lightning-Caused Wildfires, Oct 2026).
- In 2022 they burned 4,206,960 acres (NIFC Lightning-Caused Wildfires, Oct 2026).
- The 2015 total of 8,112,688 acres is the highest since 2001 (NIFC Lightning-Caused Wildfires, Oct 2026).
- Alaska alone logged 5,084,752 lightning-fire acres in 2015 (NIFC Lightning-Caused Wildfires, Oct 2026).
What did the 2020 lightning complex fires destroy?
The LNU Lightning Complex burned 363,220 acres, killed 6 people and destroyed 1,491 structures (NFPA Wildland Fires Statistics, May 2025).
- The CZU Lightning Complex burned 86,509 acres, killed 1 person and destroyed 1,490 structures (NFPA Wildland Fires Statistics, May 2025).
- NFPA values the LNU loss at $2.7 billion and the CZU loss at $3.0 billion in 2024 dollars (NFPA Wildland Fires Statistics, May 2025).
How much do lightning claims cost homeowners?
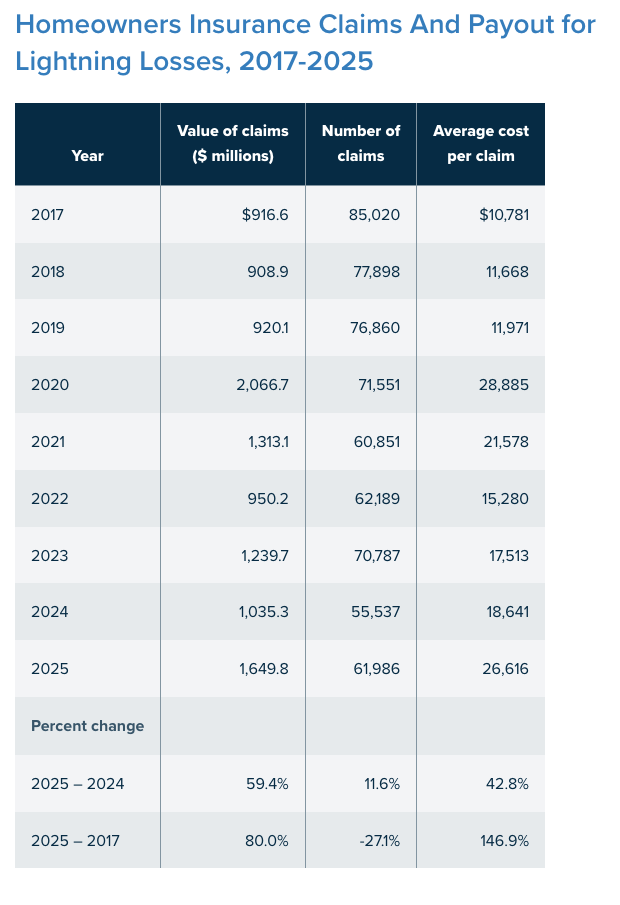
Claims are where lightning shows up in household budgets. Frequency has drifted down since 2017, but the cost of each claim has more than doubled.
How much did insurers pay for lightning claims in recent years?
Insurers handled 61,986 lightning claims in 2025, up 11.6% from 55,537 in 2024 (Triple-I Facts and Statistics: Lightning, Sep 2026).
- The 2020 payout of $2,066.7 million is the highest in the table, at an average of $28,885 per claim (Triple-I Facts and Statistics: Lightning, Sep 2026).
- The 2017 count of 85,020 claims averaged $10,781 each (Triple-I Facts and Statistics: Lightning, Sep 2026).
- Triple-I reports a 146.9% rise in the average claim from 2017 to 2025 (Triple-I Facts and Statistics: Lightning, Sep 2026).
- In 2024, insurers paid $1.04 billion across 55,537 claims, and the average claim was $18,641 (Triple-I 2024 Lightning Claims Release, Jun 2025).
Which states have the most lightning claims?
Florida had the most claims in 2025, at 5,167, with an average cost of $35,993 (Triple-I Facts and Statistics: Lightning, Sep 2026).
- California ranked second with 4,211 claims at an average of $37,159 (Triple-I Facts and Statistics: Lightning, Sep 2026).
- Texas ranked third with 4,188 claims, but its $252.9 million total was the highest and its average claim reached $60,382 (Triple-I Facts and Statistics: Lightning, Sep 2026).
- The top 10 states account for 32,056 claims and $952.9 million (Triple-I Facts and Statistics: Lightning, Sep 2026).
- In 2024 the Texas average was $38,558 (Triple-I 2024 Lightning Claims Release, Jun 2025).
How much of the damage is surge damage?
State Farm says ground surges cause nearly half of all lightning claims (Triple-I 2024 Lightning Claims Release, Jun 2025).
- Some homeowners policies cover power surges that are the direct result of a lightning strike (Triple-I 2024 Lightning Claims Release, Jun 2025).
- Lightning can reach people indoors through plumbing, electrical systems and wired devices (CDC Safety Guidelines: Lightning, Jun 2026).
- Lightning can also travel through radio and television reception systems and metal wires or bars in concrete floors (CDC Safety Guidelines: Lightning, Jun 2026).
How much does lightning cost wind farms?
Lightning damage costs the US wind industry more than $100 million a year (Xweather Annual Lightning Report 2025, Jan 2026).
- Lightning accounts for 60% of wind turbine blade losses (Xweather Annual Lightning Report 2025, Jan 2026).
- Nearly one third of the 68,000 US turbines studied were struck in 2025 (Vaisala Xweather Press Release, Jan 2026).
- One Kansas wind farm logged 3,235 strikes over 10 years, or 1.2 per turbine a year (Vaisala Xweather Press Release, Jan 2026).
What can an electrician check after a lightning surge?
A surge reaches a building through the service, so the grounding path is the first thing to check. The grounding electrode conductor is sized from the service conductor size using NEC Table 250.66, and the free size of conductor to grounding rod calculator returns that size. Always check the adopted code year and ask the local authority.
How deadly is lightning around the world?
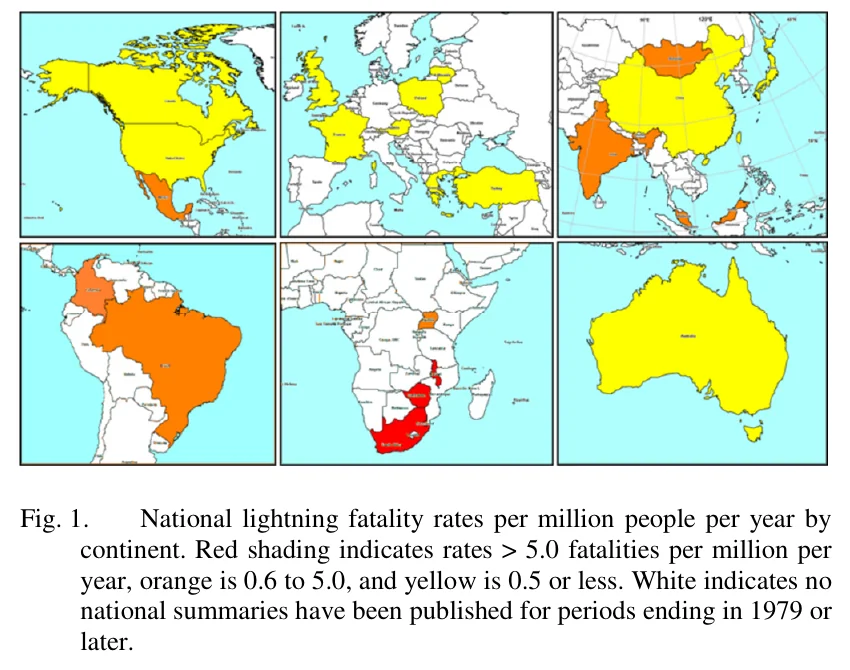
The worst lightning tolls are in places with open farm work and no lightning-safe buildings. The US numbers are low partly because most Americans can reach shelter in minutes.
How many people does lightning kill worldwide?
Studies from 24 countries document 4,101 lightning deaths a year, and the author warns that many countries are missing (Holle, Documented Global Lightning Fatalities, Apr 2016).
- NASA also cites about 240,000 injuries a year worldwide (NASA Earthdata Lightning, Oct 2026).
- A survey in Nkhata Bay District, Malawi found a lightning death rate of 84 per million people a year (PLoS ONE, Lightning Mortality in Malawi, Jan 2012).
- The same survey found 419 consequential strikes per million people a year (PLoS ONE, Lightning Mortality in Malawi, Jan 2012).
How does the US compare with other countries?
Canada averages between two and three lightning deaths and 180 injuries a year (Environment and Climate Change Canada, Lightning Statistics, Jan 2021).
- Canadian deaths fell from 9 to 10 a year in 1994 to 2003 to 2 to 3 a year in 2002 to 2017 (Environment and Climate Change Canada, Lightning Statistics, Jan 2021).
- About 90% of Canadian lightning deaths occur in Ontario, Quebec, Alberta and Saskatchewan (Environment and Climate Change Canada, Lightning Statistics, Jan 2021).
- India averaged 1,755 lightning deaths a year in one long-run study (Holle, Documented Global Lightning Fatalities, Apr 2016).
- Brazil recorded 1,965 lightning deaths from 1999 to 2020 in its national health data (Weather, Climate, and Society, Brazil Lightning Deaths, Jan 2024).
What are the world lightning records?
The longest recorded flash covered 829 km on October 22, 2017, from eastern Texas to near Kansas City (WMO Megaflash Record 2025, Jul 2025).
- It beat the previous record of 768 km by 61 km (WMO Megaflash Record 2025, Jul 2025).
- The longest single flash by time lasted 17.102 seconds, over Uruguay and northern Argentina on June 18, 2020 (WMO Megaflash Records 2022, Feb 2022).
- A single flash killed 21 people sheltering in a hut in Zimbabwe in 1975 (WMO Megaflash Records 2022, Feb 2022).
- Lightning hitting oil tanks killed 469 people in Dronka, Egypt in 1994 (WMO Megaflash Records 2022, Feb 2022).
Methodology and Sources
Every figure comes from the body that produced it: NOAA and its National Weather Service, CDC, the National Lightning Safety Council, Vaisala Xweather, Triple-I with State Farm, the National Interagency Fire Center, NFPA, NASA, the WMO, Environment and Climate Change Canada and peer-reviewed journals. No roundup pages are cited. Each URL was opened, and the number was found on the page or in the PDF before it was used. Where agencies publish a live page with no date, the month shown is the month the page was read, October 2026.
The National Weather Service and the National Lightning Safety Council count differently, so 2025 shows as 20 in one NWS table and 21 in another. Both are reported as each source states them. The Triple-I claim data covers US homeowners claims reported by State Farm and Triple-I, and Triple-I notes that a lightning fire may be filed as a fire loss. NEC is a trademark of NFPA. This page reports lightning data and does not state that any result meets a local code. The page is refreshed monthly.
Glossary
- CG: cloud-to-ground lightning, the type that reaches people and buildings.
- CDC: US Centers for Disease Control and Prevention.
- Flash and stroke: a flash is one lightning discharge. A stroke is one pulse within it.
- NIFC: National Interagency Fire Center.
- NLSC: National Lightning Safety Council.
- NWS: National Weather Service, part of NOAA.
- SPD: surge protective device.
- Storm Data: the NOAA database of weather events, deaths, injuries and damage.
- Triple-I: Insurance Information Institute.
- WMO: World Meteorological Organization.
Sources
- Albrecht et al., Bulletin of the American Meteorological Society
- CDC Lightning and Your Safety
- CDC Lightning FAQ
- CDC Lightning Strike Victim Data
- CDC Safety Guidelines: Lightning
- Earth’s Future, Lightning-Ignited Wildfire Risk
- Environment and Climate Change Canada, Lightning Statistics
- Holle, Documented Global Lightning Fatalities
- Holle, Lightning Deaths by State 1959 to 2017
- NASA Earthdata Lightning
- NASA Earthdata Maracaibo Beacon
- Natural Hazards, Lightning Mortality 1979 to 2023
- NFPA Wildland Fires Statistics
- NIFC Lightning-Caused Wildfires
- NIFC Wildfires and Acres
- NLSC Deadly Dozen
- NLSC Deaths by State 2016 to 2025
- NLSC Detailed Analysis 2006 to 2025
- NLSC Lightning Deaths
- NLSC Weighted Deaths by State
- NWS Five Ways Lightning Strikes People
- NWS Lightning Fatalities
- NWS Lightning Myths
- NWS Lightning Odds
- NWS Lightning Science
- NWS Medical Aspects of Lightning
- NWS Natural Hazard Statistics 2016
- NWS Natural Hazard Statistics 2019
- NWS Natural Hazard Statistics 2023
- NWS Natural Hazard Statistics 2024
- NWS Natural Hazard Statistics 2025
- NWS Weather Fatalities 1940 to 2025
- PLoS ONE, Lightning Mortality in Malawi
- Triple-I 2024 Lightning Claims Release
- Triple-I Facts and Statistics: Lightning
- UC Berkeley News, Lightning Expected to Increase
- Vaisala Xweather Press Release
- Weather, Climate, and Society, Brazil Lightning Deaths
- WMO Megaflash Record 2025
- WMO Megaflash Records 2022
- Xweather Annual Lightning Report 2025
Cite this page
Every figure links to the source that published it. Quote one with a link to this page or to the source.
WireGaugeCalc. "169 Struck by Lightning Statistics October 2026." WireGaugeCalc, October 2026. https://www.wiregaugecalc.com/statistics/struck-by-lightning-statistics/ <a href="https://www.wiregaugecalc.com/statistics/struck-by-lightning-statistics/">Struck by Lightning Statistics</a> (WireGaugeCalc, October 2026)