 WireGaugeCalc
133 Power Line Death Statistics October 2026
On this page
- Lineworker Fatality Statistics: How Many Linemen Die Each Year?
- Power Line Electrocution Statistics: How Much Workplace Electrocution Comes From Power Lines?
- What Causes Fatal Contact With Overhead Power Lines?
- Which Jobs Face the Highest Risk Near Power Lines?
- How Often Are Linemen Hurt but Not Killed?
- Do Power Lines Kill People Outside of Work?
- How Many People Die in Utility Pole Crashes and Fires Started by Lines?
- How Close Is Too Close to a Power Line?
- Are Safety Rules and Enforcement Keeping Lineworkers Alive?
- Methodology and Sources
- Glossary
- Sources
Power line death statistics come from several places that do not count the same way. The federal government counts every work death. Safety groups and utilities count contacts, injuries and near misses. A few public agencies count the people who die when a line is hit by a ladder, a crane, a tree or a car. This page collects the primary numbers in one spot and names the source and date for each one.
The short version is that line work is one of the deadliest jobs in the country, and most people killed by overhead lines are not lineworkers. They are laborers, roofers, painters, tree trimmers, truck drivers and members of the public who did not plan to be near a live wire. The numbers below show how many, who, how and what the rules say about it.
Every figure links to the agency, regulator, researcher or journal that produced it. Numbers from different sources measure different things, so they are not blended. Where two sources disagree, both are shown with their own scope.
Key Takeaways
- Electrical power-line installers died at 13.8 per 100,000 full-time workers in 2024, against 3.3 for all workers (BLS, Feb 2026).
- OSHA estimated 74 deaths and 444 serious injuries a year among workers covered by its electric power rule (OSHA, Apr 2014).
- Overhead power line contact caused 809 workplace electrical deaths from 2011 to 2024, or 49 percent of all workplace electrical deaths (ESFI, Mar 2026).
- Power-line installers had a construction electrocution rate of 29.7 per 100,000 workers, nearly 40 times the construction average (CPWR, Oct 2017).
- Electrocution caused 62 of the 131 deaths of electrical power-line installers from 2011 to 2015, against 3 percent of work deaths overall (BLS, Feb 2018).
- At least 154 workers died from 1992 to 2005 when metal ladders touched overhead power lines (NIOSH, Oct 2007).
- Overhead power line contact caused 32 percent of crane deaths from 1992 to 2006 (NIOSH, Apr 2021).
- Contact with overhead power lines caused 41 percent of all US electrical work deaths from 1992 to 1998 (Journal of Safety Research, Sep 2003).
- Powerline contact caused 48 percent of Ontario electrical fatalities from 2021 to 2025, up from 39 percent in the five years before (Electrical Safety Authority, Sep 2026).
- Crashes into utility poles killed 910 people in the United States in 2024 (IIHS, Jun 2026).
- The Eaton Fire killed 19 people, and Los Angeles County Fire investigators traced it to arcing on an out-of-service utility tower (LA County Fire Department, Aug 2026).
- OSHA sets a 10 foot minimum clearance for crane work near lines up to 50 kV (OSHA, Aug 2010).
Lineworker Fatality Statistics: How Many Linemen Die Each Year?
Line work is dangerous in a way that has barely changed in a decade. The count is small, because the workforce is small, but the rate is several times the national average.
How many electrical power-line installers die each year?
- Electrical power-line installers and repairers had 21 fatal work injuries in 2024 (BLS, Feb 2026).
- Telecommunications line installers and repairers had 15 fatal work injuries and a rate of 11.5 per 100,000 workers in 2024 (BLS, Feb 2026).
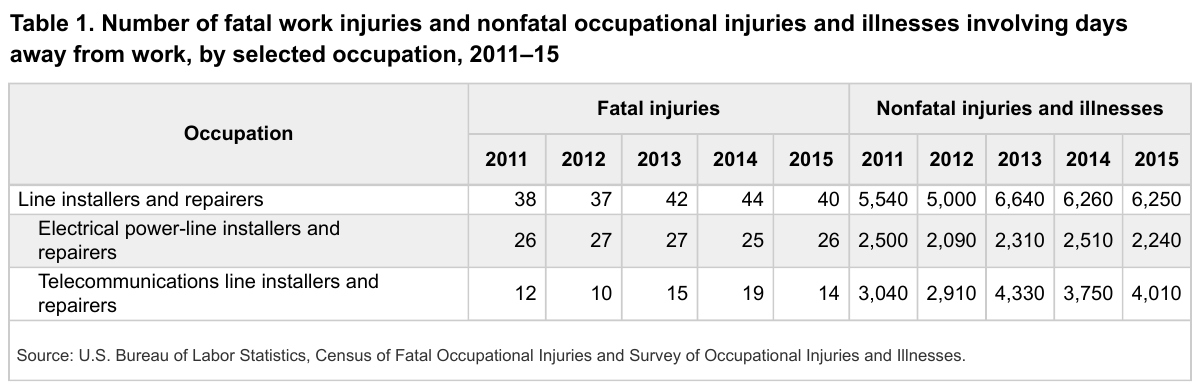
- Line installers and repairers suffered 201 fatal work injuries from 2011 to 2015, about 40 per year (BLS, Feb 2018).
- Electrical power-line installers accounted for 131 of those deaths and telecommunications line installers for 70 (BLS, Feb 2018).
- Annual deaths among electrical power-line installers stayed between 25 and 27 in every year from 2011 to 2015 (BLS, Feb 2018).
What is the fatality rate for lineworkers?
- The fatal injury rate for electrical power-line installers peaked at 23.9 per 100,000 workers in 2012 (BLS, Feb 2018).
- The occupation made BLS’s list of 10 civilian jobs with high fatal injury rates in every year from 2011 to 2015 (BLS, Feb 2018).
- Electrical power-line installers had an average electrical fatality rate of 6.01 per 100,000 workers from 2011 to 2024, against 0.11 for all occupations (ESFI, Mar 2026).
- Linemen had a fatal injury rate ratio of 3.33 in a study of 127,129 men at five US power companies (American Journal of Industrial Medicine, Mar 1999).
- The overall fatal injury rate in that utility cohort was 13.20 per 100,000 person-years (American Journal of Industrial Medicine, Mar 1999).
- Line workers made up 21 of the 63 fatalities in an 18-company utility injury database covering 1995 to 2013 (Journal of Safety Research, Feb 2017).
- Seven of the 24 deaths in a separate utility worker database came from contact with electric current or temperature extremes (Burns, Mar 2007).
Which industries employ the lineworkers who die?
- Three industries accounted for over 95 percent of electrical power-line installer deaths from 2011 to 2015 (BLS, Feb 2018).
- Power and communication line construction recorded 29 fatal injuries in 2024 (BLS, Feb 2026).
- The same industry recorded 33 fatal injuries in 2023 (BLS, Dec 2024).
- Electric power generation, transmission and distribution recorded 19 fatal injuries in 2024 (BLS, Feb 2026).
- That industry recorded 30 fatal injuries in 2023 (BLS, Dec 2024).
- Of the 30 fatal injuries in the whole utilities sector in 2024, 15 came from exposure to harmful substances or environments, the BLS group that includes electricity (BLS, Feb 2026).
Power Line Electrocution Statistics: How Much Workplace Electrocution Comes From Power Lines?
Power lines are the single biggest source of fatal electric shock at work. The share has been close to half in nearly every study since the 1990s, in two different federal counts and several independent ones.
What share of electrical deaths involves power lines?
- Overhead power line contact accounted for 27 percent of electrical deaths among electrical occupations (ESFI, Mar 2026).
- It accounted for 57 percent of electrical deaths among non-electrical occupations (ESFI, Mar 2026).
- Non-electrical occupations accounted for 70 percent of all workplace electrical deaths reported to OSHA from 2011 to 2024 (ESFI, Mar 2026).
- Overhead power line contact made up 44 percent of all electrical deaths from 1992 to 2010 in the BLS census (ESFI, Jan 2015).
- A review of BLS data counted 2,287 US workers killed by electric shock or burns from 1992 to 1998 (Journal of Safety Research, Sep 2003).
- Construction workers made up 44 percent of those electrical deaths while holding about 7 percent of jobs (Journal of Safety Research, Sep 2003).
- In Virginia from 1977 to 1985, 53 percent of accidental work electrocutions came from power line contact (Journal of Occupational Medicine, Jan 1991).
- An OSHA database study of 944 work electrocutions from 1984 to 1986 found that 61 percent came from contact with high-voltage power lines (NIOSH, May 1998).
How does construction fit into the picture?
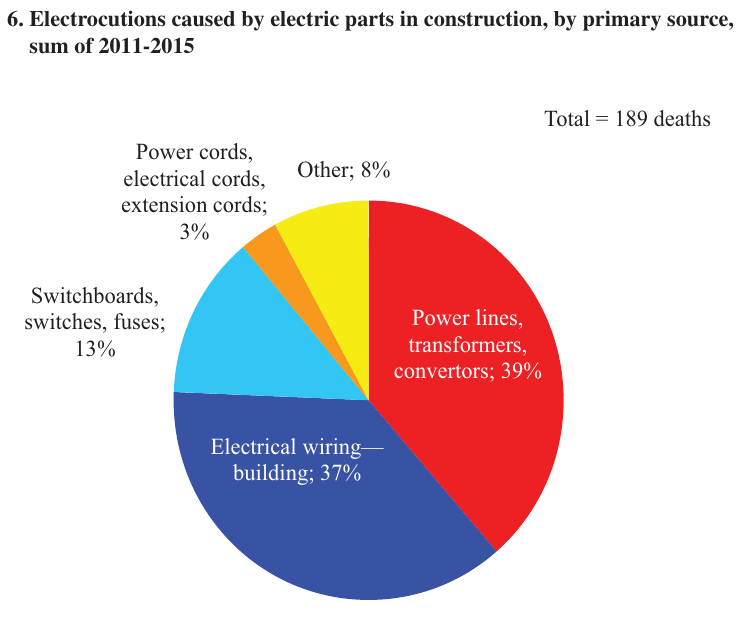
- Power lines, transformers and converters caused 39 percent of the 189 construction electrocutions from electric parts between 2011 and 2015 (CPWR, Oct 2017).
- The US had 1,501 fatal electrical injuries from 2011 to 2020 (CPWR, Nov 2022).
- Construction accounted for 49.1 percent of them, or 737 deaths (CPWR, Nov 2022).
- Indirect exposure, such as a crane touching a power line, caused 38.9 percent of fatal construction electrical injuries from 2011 to 2018 (CPWR, Nov 2022).
- Among those indirect exposures, 87.4 percent involved more than 220 volts (CPWR, Nov 2022).
- A study of 1,019 construction electrical deaths from 1992 to 1998 found that overhead power lines were the major cause of death among non-electrical workers (American Journal of Industrial Medicine, Apr 2003).
- Electrocutions made up 20.4 percent of construction deaths in North Carolina from 1978 to 1994 (Applied Occupational and Environmental Hygiene, Jan 2002).
What Causes Fatal Contact With Overhead Power Lines?
Most of these deaths are not a worker grabbing a wire. They happen when something long, tall or metal gets close to one. The line is often in plain sight.
What do workers touch when they are killed?
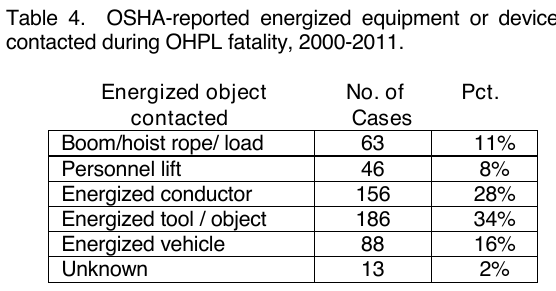
- Energized tools and objects such as hand tools, metal ladders and scaffolds were involved in 34 percent of OSHA-recorded overhead line deaths from 2000 to 2011 (ESFI, Jan 2015).
- Direct contact with an energized conductor accounted for 28 percent (ESFI, Jan 2015).
- Energized vehicles accounted for 16 percent (ESFI, Jan 2015).
- Booms, hoist ropes and loads accounted for 11 percent, and personnel lifts for 8 percent (ESFI, Jan 2015).
- OSHA recorded 552 worker deaths from contact near overhead lines between 2000 and 2011 (ESFI, Jan 2015).
- Incidental contact, meaning work not normally tied to line hazards, was involved in 68 percent of those cases (ESFI, Jan 2015).
- Line maintenance was involved in 26 percent, and line construction in 5 percent (ESFI, Jan 2015).
- Among cases that reported a voltage, the 6 to 9.99 kV class was the most common, at 36 percent of all cases (ESFI, Jan 2015).
How often do cranes and boomed vehicles hit lines?
- Accidental contact by mobile equipment accounts for 20 percent of on-the-job electrocutions (NIOSH, Nov 2008).
- NIOSH counted an average of 15 deaths a year from 1980 to 1989 when a crane or boomed vehicle touched an energized overhead line (NIOSH, May 1998).
- Death certificates tied 337 of 5,348 electrocutions from 1980 to 1992 to a boomed vehicle touching an energized source (NIOSH, May 1998).
- OSHA investigated 502 crane deaths in construction from 1984 to 1994 (Journal of Occupational and Environmental Medicine, Dec 1999).
- Electrocution was the largest category, with 198 of those deaths, or 39 percent (Journal of Occupational and Environmental Medicine, Dec 1999).
- Of the NIOSH-investigated electrocution incidents at 7,200 volts or more from 1982 to 1994, 41, or 28 percent, involved a boomed vehicle touching a line (NIOSH, May 1998).
What about ladders, scaffolds and farm equipment?
- Death certificates tied 217 electrocutions from 1980 to 1992 to a ladder or scaffold touching an energized source (NIOSH, May 1998).
- NIOSH also counted 35 incidents in which conductive equipment such as an aluminum ladder or scaffold touched an energized power line (NIOSH, May 1998).
- Hispanic workers made up 23 percent of the metal ladder and power line deaths from 1992 to 2005, with 36 deaths, but 11 percent of the workforce (NIOSH, Oct 2007).
- Death certificates tied 82 electrocutions from 1980 to 1992 to energized grain augers or elevators (NIOSH, May 1998).
- Electrocutions made up about 7 percent of agricultural work deaths in a review cited by NIOSH (NIOSH, May 1998).
Which Jobs Face the Highest Risk Near Power Lines?
Linemen top the rate tables. They do not top the body count. Because the hazard is simple to meet and easy to ignore, trades with little electrical training account for many of the deaths.
Which occupations have the highest electrocution rates?
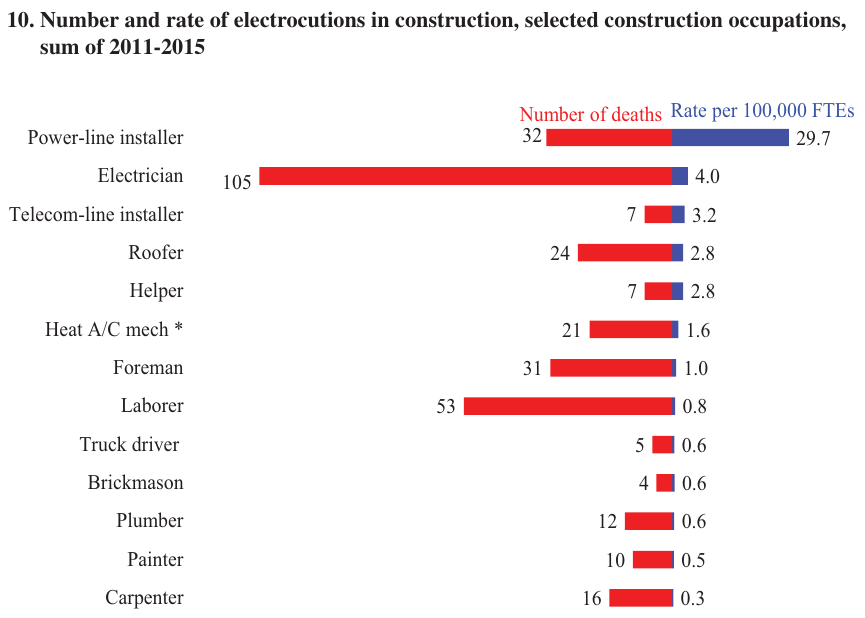
- Power-line installers had 32 construction electrocution deaths from 2011 to 2015 (CPWR, Oct 2017).
- Electricians had the next highest rate in that comparison, at 4.0 per 100,000 workers (CPWR, Oct 2017).
- The power-line installer electrocution rate was 39.0 in 2003, fell to 15.1 in 2010, then rose to 47.5 in 2015 (CPWR, Oct 2017).
- Electrical power line installers and repairers plus their supervisors were involved in 91 of the 552 OSHA-recorded overhead line deaths, or 16 percent (ESFI, Jan 2015).
- OSHA’s records left the occupation blank in 247 of those 552 cases (ESFI, Jan 2015).
- Line installers and their supervisors touched an energized conductor in 77 percent of their own fatal overhead line cases (ESFI, Jan 2015).
Which industries lose the most workers to overhead lines?
- Water, sewer, pipeline, and communications and power line construction recorded 80 overhead line deaths from 2000 to 2011 (ESFI, Jan 2015).
- Electrical work contractors recorded 51 and roofing and sheet metal contractors recorded 51 (ESFI, Jan 2015).
- Electric power distribution recorded 47 (ESFI, Jan 2015).
- Ornamental shrub and tree services recorded 32 (ESFI, Jan 2015).
- Specialty trade contractors accounted for 71 percent of fatal construction electrical injuries from 2011 to 2020 (CPWR, Nov 2022).
How dangerous is tree work near power lines?
- NIOSH counted 207 tree trimmer deaths from 1980 to 1989, about 21 a year (NIOSH, Aug 1992).
- Electrocution was the leading cause, with 74 of those deaths, or 36 percent (NIOSH, Aug 1992).
- A later count found 1,285 tree care deaths from 1992 to 2007, with electrocutions behind 14 percent (MMWR, Apr 2009).
- Electrocutions from power lines made up 18.3 percent of 95 landscaping and tree care worker deaths in 93 FACE reports covering 1987 to 2023 (Journal of Safety Research, Dec 2024).
- More than 66 percent of those deaths happened to workers who had been on the job a year or less (Journal of Safety Research, Dec 2024).
How Often Are Linemen Hurt but Not Killed?
For every line worker who dies, many more are hurt badly enough to miss work. The injuries also keep people out longer than the average job does.
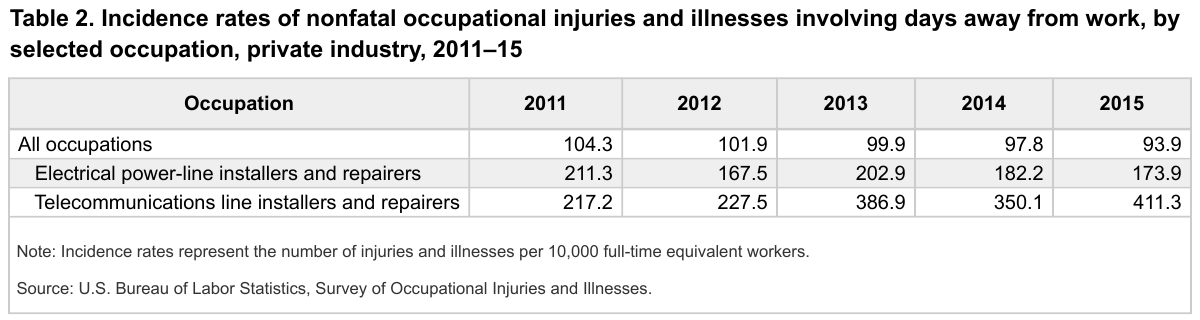
How do nonfatal injury rates compare?
- The nonfatal rate for electrical power-line installers was 173.9 per 10,000 workers in 2015, against 93.9 for all occupations (BLS, Feb 2018).
- The rate for the occupation was 211.3 in 2011 (BLS, Feb 2018).
- Line workers had an injury rate of 10.37 per 100 employee-years in an 18-company utility database, third behind welders and meter readers (Journal of Safety Research, Feb 2017).
- The same database recorded 63,193 injuries over 1,977,436 employee-years, an overall rate of 3.20 per 100 (Journal of Safety Research, Feb 2017).
How severe are the injuries?
- Electrical power-line installers had a median of 20 days away from work in 2015, against 8 for all occupations (BLS, Feb 2018).
- Cases of 31 or more days away from work made up 44.3 percent of their injuries, against 28.6 percent for all occupations (BLS, Feb 2018).
- Electric burns were 45.8 percent of the 872 burn and shock injuries in one utility worker database (Burns, Mar 2007).
- Burns and shocks were 3.7 percent of injuries in that database but nearly 13 percent of medical claim costs (Burns, Mar 2007).
- One burn center treated 700 electrical injury patients from 1982 to 2002, and the high-voltage group, mostly linemen and electricians, had the most complications (Journal of Burn Care and Rehabilitation, Nov 2004).
- High-voltage injuries had a 5.3 percent mortality rate at that burn center (Journal of Burn Care and Rehabilitation, Nov 2004).
- In a Tehran burn hospital, 105 of 202 electrical injury patients were construction workers, and overhead power lines were the most common cause (Burns, Mar 2014).
Where do other line-work deaths come from?
- Transportation incidents caused 58 deaths among line installers and repairers from 2011 to 2015 (BLS, Feb 2018).
- Falls to a lower level caused 43 (BLS, Feb 2018).
- More than two-fifths of line-worker fatal falls were from 30 feet or higher (BLS, Feb 2018).
- Summer was the deadliest season, with 69 deaths from June through August (BLS, Feb 2018).
Do Power Lines Kill People Outside of Work?
Federal work data cannot answer this, because it only counts workers. Ontario’s electrical safety regulator publishes a full count, and its numbers show the public share rising while the construction share falls.
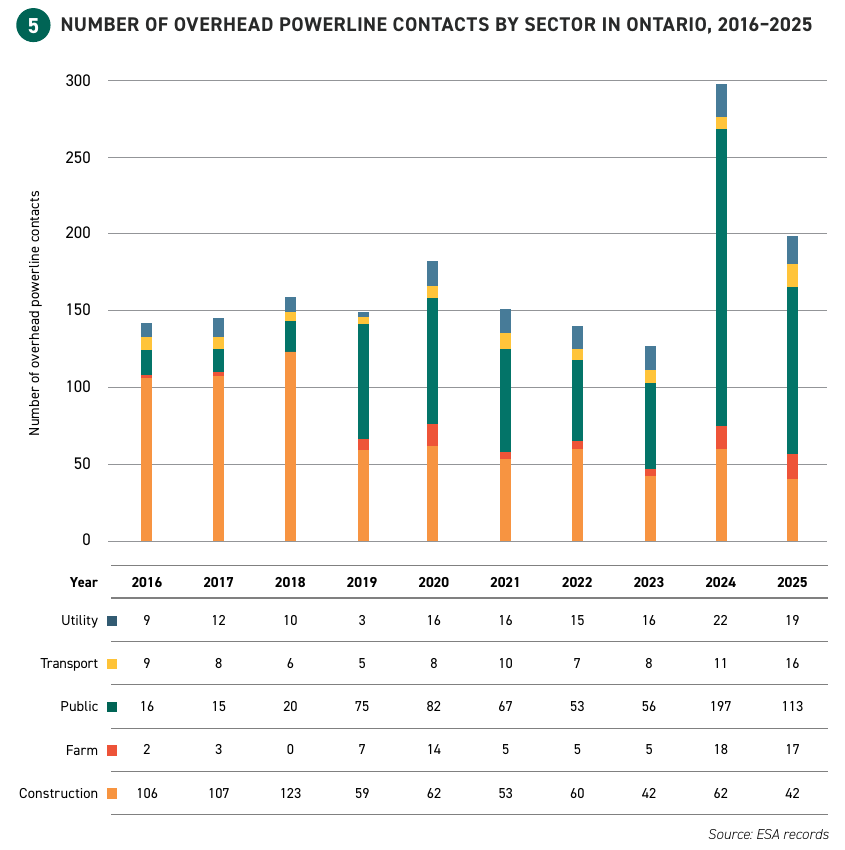
How many public deaths involve powerlines in Ontario?
- The rate of powerline fatalities at home or in recreation rose by 67 percent between 2016 to 2020 and 2021 to 2025 (Electrical Safety Authority, Sep 2026).
- The five-year rolling average rate of powerline electrocutions rose 17 percent over the same comparison (Electrical Safety Authority, Sep 2026).
- Contact with powerlines accounted for 20 deaths in ten years and 83 percent of utility-related equipment fatalities (Electrical Safety Authority, Sep 2026).
- Powerline contact while working caused 41 percent of occupational electrical fatalities from 2016 to 2025 (Electrical Safety Authority, Sep 2026).
How often do people hit lines in public places?
- The five-year average of overhead powerline incidents rose 21 percent, from 155 in 2016 to 2020 to 188 in 2021 to 2025 (Electrical Safety Authority, Sep 2026).
- Public-setting overhead contacts reached 197 in 2024, with tree-related incidents named as a driver (Electrical Safety Authority, Sep 2026).
- Construction overhead contacts fell from 123 in 2018 to 42 in 2025 (Electrical Safety Authority, Sep 2026).
- Farm overhead contacts reached 18 in 2024 (Electrical Safety Authority, Sep 2026).
- The regulator tells Ontarians that anyone or any tool within three metres of an overhead powerline is too close (Electrical Safety Authority, May 2026).
How Many People Die in Utility Pole Crashes and Fires Started by Lines?
Power lines also kill people who never touch them. A car that hits a pole and a fire that starts from an arcing conductor both belong in the count, though they are tracked by other agencies.
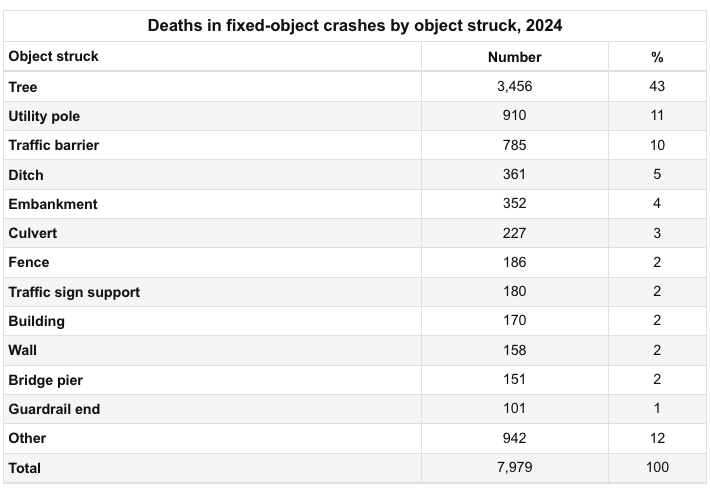
How many crash deaths involve utility poles?
- Utility poles accounted for 11 percent of the 7,979 deaths in fixed-object crashes in 2024 (IIHS, Jun 2026).
- Trees accounted for 43 percent and traffic barriers for 10 percent (IIHS, Jun 2026).
- About 20 percent of all motor vehicle crash deaths come from a vehicle hitting a fixed object (IIHS, Jun 2026).
How many wildfire deaths trace to power equipment?
- The Camp Fire in 2018 caused at least 85 civilian deaths and was ignited by a faulty electric transmission line (CAL FIRE, Nov 2018).
- PG&E electrical equipment was involved in igniting a series of 17 wildfires in Northern California in 2017 and 2018 (CPUC, Jul 2022).
- The Eaton Fire destroyed or damaged over 9,000 homes and businesses (LA County Fire Department, Aug 2026).
How Close Is Too Close to a Power Line?
The federal answer depends on voltage. The distances below come from OSHA’s crane rule, which many safety programs use as a working yardstick for any tall equipment.
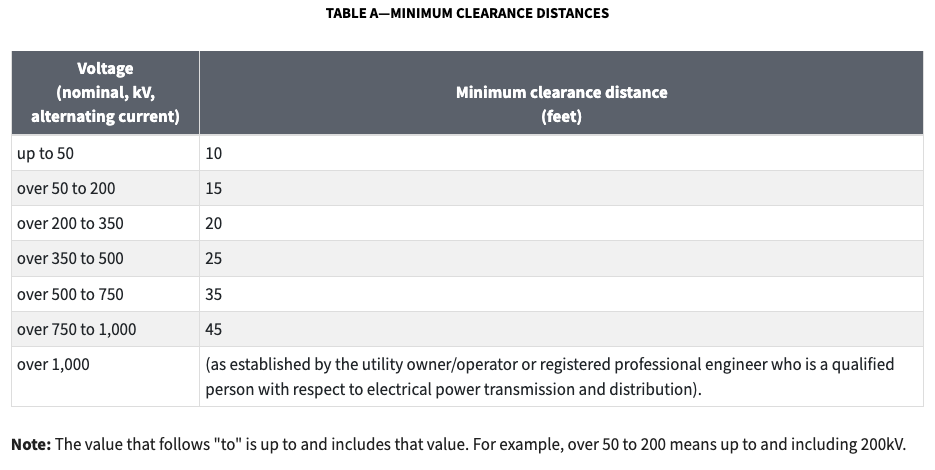
What are the minimum clearance distances?
- The minimum clearance is 15 feet for lines over 50 kV up to 200 kV (OSHA, Aug 2010).
- It is 20 feet for lines over 200 kV up to 350 kV (OSHA, Aug 2010).
- It is 25 feet for lines over 350 kV up to 500 kV (OSHA, Aug 2010).
- It is 35 feet for lines over 500 kV up to 750 kV (OSHA, Aug 2010).
- It is 45 feet for lines over 750 kV up to 1,000 kV (OSHA, Aug 2010).
What triggers extra precautions?
- If any part of the equipment or load could get closer than 20 feet to a power line, the employer must choose to de-energize and ground it, keep a 20 foot clearance, or use the Table A distance (OSHA, Aug 2010).
- Where the Table A option is used, the utility owner must give requested voltage information within two working days (OSHA, Aug 2010).
- In NIOSH case studies, 26 utility line workers, or 55 percent of those who died, were not using required protective equipment such as gloves, sleeves or mats (NIOSH, May 1998).
Are Safety Rules and Enforcement Keeping Lineworkers Alive?
Rules help, and OSHA’s own numbers say how much. The harder question is whether enforcement and training keep pace, and the construction data suggest they have not.
What did OSHA expect its electric power rule to prevent?
- OSHA expected full compliance with its 2014 rule to prevent 79.6 percent of relevant injuries and deaths, against 52.9 percent under the older standards (OSHA, Apr 2014).
- That works out to about 19.75 additional deaths prevented a year (OSHA, Apr 2014).
- It also works out to about 118.5 additional serious injuries prevented a year (OSHA, Apr 2014).
- OSHA valued each prevented death at $8.7 million (OSHA, Apr 2014).
- It estimated annual monetized benefits of $179.2 million (OSHA, Apr 2014).
- It estimated net benefits of about $129.7 million a year with costs annualized at 7 percent (OSHA, Apr 2014).
Is enforcement keeping up?
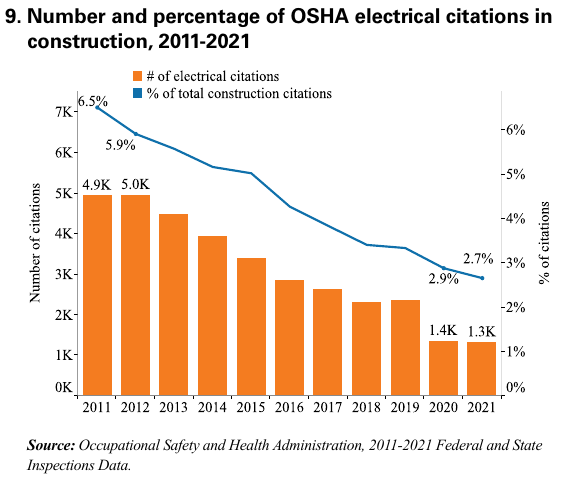
- OSHA citations for electrical standards in construction fell 73.5 percent from 2011 to 2021, from 4.9 thousand to 1.3 thousand (CPWR, Nov 2022).
- They fell from 6.5 percent to 2.7 percent of all construction citations (CPWR, Nov 2022).
- OSHA penalized the construction industry for an average of $3.2 million a year for electrical violations from 2011 to 2021 (CPWR, Nov 2022).
- Total electrical penalties in construction fell 57.8 percent, from $4.5 million in 2011 to $1.9 million in 2021 (CPWR, Nov 2022).
How large is the workforce at risk?
- There were 131,900 electrical power-line installer and repairer jobs in 2025 (BLS, Aug 2026).
- BLS projects 10 percent growth from 2025 to 2035, an increase of 13,600 jobs (BLS, Aug 2026).
- About 10,900 openings a year are projected over the decade (BLS, Aug 2026).
- NIOSH found that 41 percent of the 244 electrocution victims in its FACE case studies had been on the job less than a year (NIOSH, May 1998).
- Electrocution victims in those case studies lost an average of 33 years of potential life (NIOSH, May 1998).
Methodology and Sources
Every number comes from the agency, regulator, research group or journal that produced it, and each link points to that document. Aggregator pages and roundups were not used. Counts from BLS, OSHA records, hospital studies and Ontario regulator files measure different things and cover different years, so they are shown side by side and not added together. Where a source reports a share of a subset, such as OSHA-recorded cases with a stated voltage, the subset is named. This page is refreshed monthly as new releases appear.
Glossary
- BLS: US Bureau of Labor Statistics.
- CFOI: Census of Fatal Occupational Injuries, the BLS count of work deaths.
- CPWR: The Center for Construction Research and Training.
- ESFI: Electrical Safety Foundation International.
- FACE: Fatality Assessment and Control Evaluation, a NIOSH program that investigates work deaths.
- FTE: Full-time equivalent worker.
- IIHS: Insurance Institute for Highway Safety.
- kV: Kilovolt, 1,000 volts.
- NIOSH: National Institute for Occupational Safety and Health.
- OHPL: Overhead power line.
- OSHA: Occupational Safety and Health Administration.
- SOII: Survey of Occupational Injuries and Illnesses, the BLS count of nonfatal work injuries.
Sources
- BLS, Rate and number of fatal work injuries in selected occupations, 2024
- BLS, Fatal occupational injuries by industry and event, Table A-1, 2024
- BLS, Fatal occupational injuries by industry and event, Table A-1, 2023
- BLS, Workplace hazards facing line installers and repairers
- BLS, Occupational Outlook Handbook, Electrical Power-Line Installers and Repairers
- OSHA, Electric Power Generation, Transmission, and Distribution final rule
- OSHA, 1926.1408 Power line safety (up to 350 kV)
- NIOSH, Worker Deaths by Electrocution
- NIOSH, Metal ladders and power lines update
- NIOSH, Preventing Falls and Electrocutions During Tree Trimming
- NIOSH, A Performance Evaluation of Two Overhead Power Line Proximity Warning Devices
- NIOSH, Preventing Struck-by Injuries in Construction: Lift Zone Safety
- ESFI, Workplace Injury and Fatality Statistics
- ESFI, Overhead Powerline Safety
- ESFI, Occupations Most At-Risk in Fatal Overhead Power Line Incidents
- CPWR, Electrocutions and Prevention in Construction
- CPWR, Electrical Injuries and Citations in Construction
- Electrical Safety Authority, 2025 Ontario Electrical Safety Report
- Electrical Safety Authority, Powerline Safety Week news release
- IIHS, Fatality Facts 2024: Collisions with fixed objects and animals
- CAL FIRE, Remembering the Camp Fire
- CPUC, Root cause analysis of the 2017 wildfires and the 2018 Camp Fire
- LA County Fire Department, Eaton Fire investigative reports
- Journal of Safety Research, Occupational electrical injuries in the United States, 1992-1998
- Journal of Occupational and Environmental Medicine, Fatal injuries in the US construction industry involving cranes 1984-1994
- American Journal of Industrial Medicine, Fatal occupational injuries among electric power company workers
- Journal of Safety Research, Injuries among electric power industry workers, 1995-2013
- Burns, Thermal burn and electrical injuries among electric utility workers, 1995-2004
- Journal of Occupational Medicine, Fatal occupational electrical injuries in Virginia
- American Journal of Industrial Medicine, Causes of electrical deaths and injuries among construction workers
- Applied Occupational and Environmental Hygiene, Fatal occupational injuries in the North Carolina construction industry, 1978-1994
- MMWR, Work-related fatalities associated with tree care operations, 1992-2007
- Journal of Safety Research, Fatal injuries among landscaping and tree care workers
- Journal of Burn Care and Rehabilitation, Electrical injuries: a 20-year review
- Burns, Electrical injury in construction workers
Cite this page
Every figure links to the source that published it. Quote one with a link to this page or to the source.
WireGaugeCalc. "133 Power Line Death Statistics October 2026." WireGaugeCalc, October 2026. https://www.wiregaugecalc.com/statistics/power-line-death-statistics/ <a href="https://www.wiregaugecalc.com/statistics/power-line-death-statistics/">Power Line Death Statistics</a> (WireGaugeCalc, October 2026)