 WireGaugeCalc
158 Electrocution Statistics October 2026
On this page
- How Many People Die From Electric Shock in the US Each Year?
- What Do Electrical Safety Statistics Show About Work Deaths?
- Which Jobs and Industries Carry the Most Electrical Injury Risk?
- How Common Are Electrical Injuries That Do Not Kill?
- What Do OSHA Electrical Statistics Show for Construction Sites?
- How Many People Die From Electric Shock at Home?
- How Many Children Die or Get Hurt From Electrical Injuries?
- Methodology and Sources
- Glossary
- Sources
Electrocution statistics come from four main places: death certificates, the federal count of work deaths, hospital injury reports and OSHA case files. Each one counts a different group of people, so no single number says how many die from electric shock. This page keeps the groups apart and names the source of every figure.
The pattern is steady. Work deaths are less than half of their 1990s level, but they have moved in a narrow band since 2012. Home deaths are fewer, skew male, and include causes few people expect, such as a hobby that reuses microwave parts.
Updated October 2026. Each figure comes from the newest release of its source on that date. Electrical work depends on the code year and the local authority, so check both before you rely on any number here for a job.
Key Takeaways
- 130 US workers died from exposure to electricity in 2024, down from 142 in 2023 (BLS, Feb 2026).
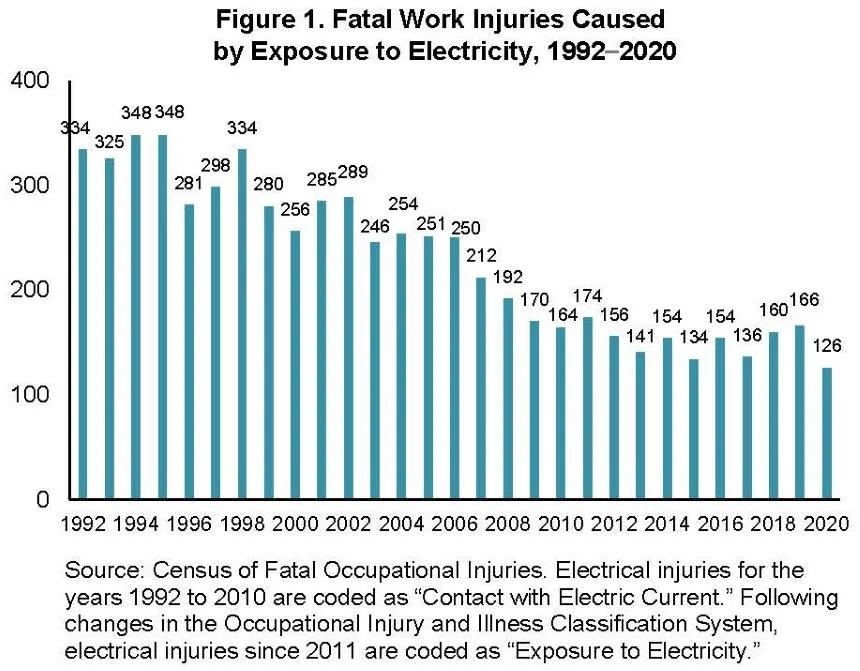
- Work deaths from electricity peaked at 348 in 1994 and fell to 126 in 2020, the lowest count in nearly 30 years of data (NFPA, May 2022).
- About 100 people a year died from electrocution tied to a consumer product between 2018 and 2020 (CPSC, Nov 2023).
- Men made up 89% of consumer product electrocution deaths from 2018 to 2020 (CPSC, Nov 2023).
- Fractal wood burning, a hobby that uses high voltage, was tied to 65 deaths from 2011 to 2020 and was the most common product in 2018, 2019 and 2020 (CPSC, Nov 2023).
- 70% of workplace electrical deaths happen to people in non-electrical occupations (ESFI, Mar 2026).
- 105 electricians died of electrocution from 2011 to 2015, more than any other construction trade (NIOSH, Feb 2019).
- Construction accounted for 52 of the 130 US deaths from electricity in 2024 (BLS, Feb 2026).
- OSHA citations for electrical standards in construction fell 73.5% between 2011 and 2021 (CPWR, Nov 2022).
- Workers had 5,180 electrical injuries with days away from work in 2023 and 2024 combined, up 59% from the two years before (ESFI, Mar 2026).
- One third of fatal work electrical injuries in 2020 happened at a private residence (NFPA, May 2022).
- Adults aged 45 to 64 died from consumer product electrocution at about four times the rate of children from 2018 to 2020 (CPSC, Nov 2023).
- An estimated 1,042 children visited emergency rooms for electrical burns to the mouth between 1997 and 2012 (Otolaryngology-Head and Neck Surgery, Jul 2016).
- The federal maximum penalty for a willful or repeated OSHA violation is $165,514 per violation (OSHA, May 2026).
How Many People Die From Electric Shock in the US Each Year?
Death certificates give the widest count, and they show a flat line, not a crisis or a success story. The workplace count is a small slice of it.
How many electrocution deaths do death certificates record?
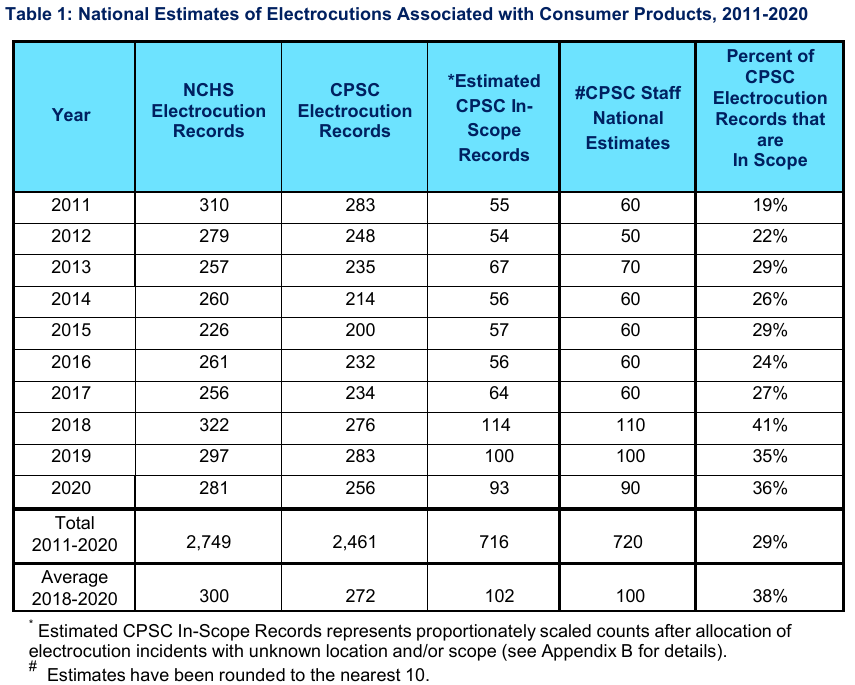
The National Center for Health Statistics logged 2,749 electrocution deaths between 2011 and 2020, about 275 a year.
- The National Center for Health Statistics held 2,749 electrocution death records for 2011 through 2020 (CPSC, Nov 2023).
- The yearly count peaked at 322 records in 2018 (CPSC, Nov 2023).
- The lowest yearly count was 226 records in 2015 (CPSC, Nov 2023).
- The count was 281 records in 2020 (CPSC, Nov 2023).
- CPSC staff estimated that 716 of the 2011 to 2020 deaths were unintentional, not work-related and tied to a consumer product (CPSC, Nov 2023).
Is the electrocution death rate rising or falling?
The age-adjusted rate for consumer product deaths roughly doubled between 2011 and 2018, then eased.
- The age-adjusted rate was 0.178 deaths per million people in 2011 (CPSC, Nov 2023).
- The rate was 0.347 per million in 2018 and 0.282 in 2020 (CPSC, Nov 2023).
- CPSC found statistical evidence of an increasing trend in the age-adjusted rate across 2011 to 2020 (CPSC, Nov 2023).
How many work deaths come from electricity?
Work deaths from electricity have stayed between about 125 and 170 a year for a decade.
- The Census of Fatal Occupational Injuries counted 134 deaths from exposure to electricity in 2015 (BLS, Dec 2020).
- The count was 166 in 2019 (BLS, Dec 2020).
- The count was 152 in 2021 (BLS, Dec 2022).
- The count was 145 in 2022 (BLS, Dec 2023).
- Electricity caused 2,070 of 70,276 workplace deaths from 2011 through 2024 (ESFI, Mar 2026).
What Do Electrical Safety Statistics Show About Work Deaths?
Work deaths from electricity have dropped by more than half since 1994, but the gains stalled after 2012. The mix of who dies has barely moved.
How much have work deaths from electricity fallen?
- The census counted 334 deaths in 1992 (NFPA, May 2022).
- The count was 250 in 2006 (NFPA, May 2022).
- The count was 164 in 2010 (NFPA, May 2022).
- The 2020 count was a 24% drop from 2019, and NFPA said the pandemic job losses likely played a part (NFPA, May 2022).
How do workers come into contact with the current?
- Direct exposure, such as touching a live conductor, accounted for 61 deaths in 2024 (BLS, Feb 2026).
- Indirect exposure, such as a ladder or crane touching a conductor, accounted for 56 deaths in 2024 (BLS, Feb 2026).
- Electric arc exposure accounted for 7 deaths in 2024 (BLS, Feb 2026).
- Direct exposure to more than 220 volts caused 32 deaths in 2024, against 19 at 220 volts or less (BLS, Feb 2026).
- Indirect exposure to more than 220 volts caused 50 of the 56 indirect deaths in 2024 (BLS, Feb 2026).
- In 2020, 56% of the deaths came from direct exposure (NFPA, May 2022).
- Unexpected contact with energized equipment on the item being worked on caused 325 deaths in OSHA fatality reports from 2011 to 2024 (ESFI, Mar 2026).
- Contact with nearby energized equipment caused 204 deaths in the same reports (ESFI, Mar 2026).
- Arc flash was named in 26 deaths in the same reports (ESFI, Mar 2026).
Where and while doing what do workers die?
- 31% of the 2020 fatal electrical injuries took place at an industrial site (NFPA, May 2022).
- 14% took place on a street or highway (NFPA, May 2022).
- 64% of the victims were constructing, repairing or cleaning when they touched the current (NFPA, May 2022).
- 22% were using or operating tools or machinery (NFPA, May 2022).
Who are the victims of fatal work electrical injuries?
- 99% of the 2020 victims were men (NFPA, May 2022).
- One third were aged 25 to 34, and one fifth were aged 35 to 44 (NFPA, May 2022).
- Nine victims, 7% of the total, were aged 18 or 19 (NFPA, May 2022).
- 40% of the 2020 victims were of Hispanic origin (NFPA, May 2022).
- Hispanic or Latino workers made up about 19% of the workforce but 29% of electrical deaths from 2011 to 2024 (ESFI, Mar 2026).
- The average electrical fatality rate per 100,000 workers from 2011 to 2024 was 0.18 for Hispanic or Latino workers, 0.10 for white non-Hispanic workers and 0.06 for Black non-Hispanic workers (ESFI, Mar 2026).
- Wage and salary workers accounted for 80% of the deaths and the self-employed for 20% (ESFI, Mar 2026).
Which Jobs and Industries Carry the Most Electrical Injury Risk?
The people most exposed are not the only people who die. Most victims do not hold an electrical job, which means training aimed only at electricians misses them.
Which industries have the most deaths from electricity?
- Manufacturing had 8 deaths from electricity in 2024 (BLS, Feb 2026).
- Trade, transportation and utilities had 16 (BLS, Feb 2026).
- Professional and business services, which includes landscaping, had 26 (BLS, Feb 2026).
- Construction had 907 deaths from 2011 to 2024, ahead of professional and business services at 212 and trade, transportation and utilities at 171 (ESFI, Mar 2026).
- Natural resources and mining had 138 deaths and manufacturing 120 over the same years (ESFI, Mar 2026).
- Construction had an average fatal electrical rate of 0.73 per 100,000 workers, against 0.11 for all industries (ESFI, Mar 2026).
- Specialty trade contractors accounted for 71.1% of construction’s fatal electrical injuries from 2011 to 2020 (CPWR, Nov 2022).
Which occupations carry the highest fatal electrical rates?
- Electricians had an average fatal electrical rate of 2.89 per 100,000 workers from 2011 to 2024 (ESFI, Mar 2026).
- Roofers had an average rate of 2.56 (ESFI, Mar 2026).
- Grounds maintenance workers had 1.34 (ESFI, Mar 2026).
- Heating, air conditioning and refrigeration mechanics had 0.98 (ESFI, Mar 2026).
- Construction laborers had 0.59 and construction and maintenance painters 0.35, against 0.11 for all occupations (ESFI, Mar 2026).
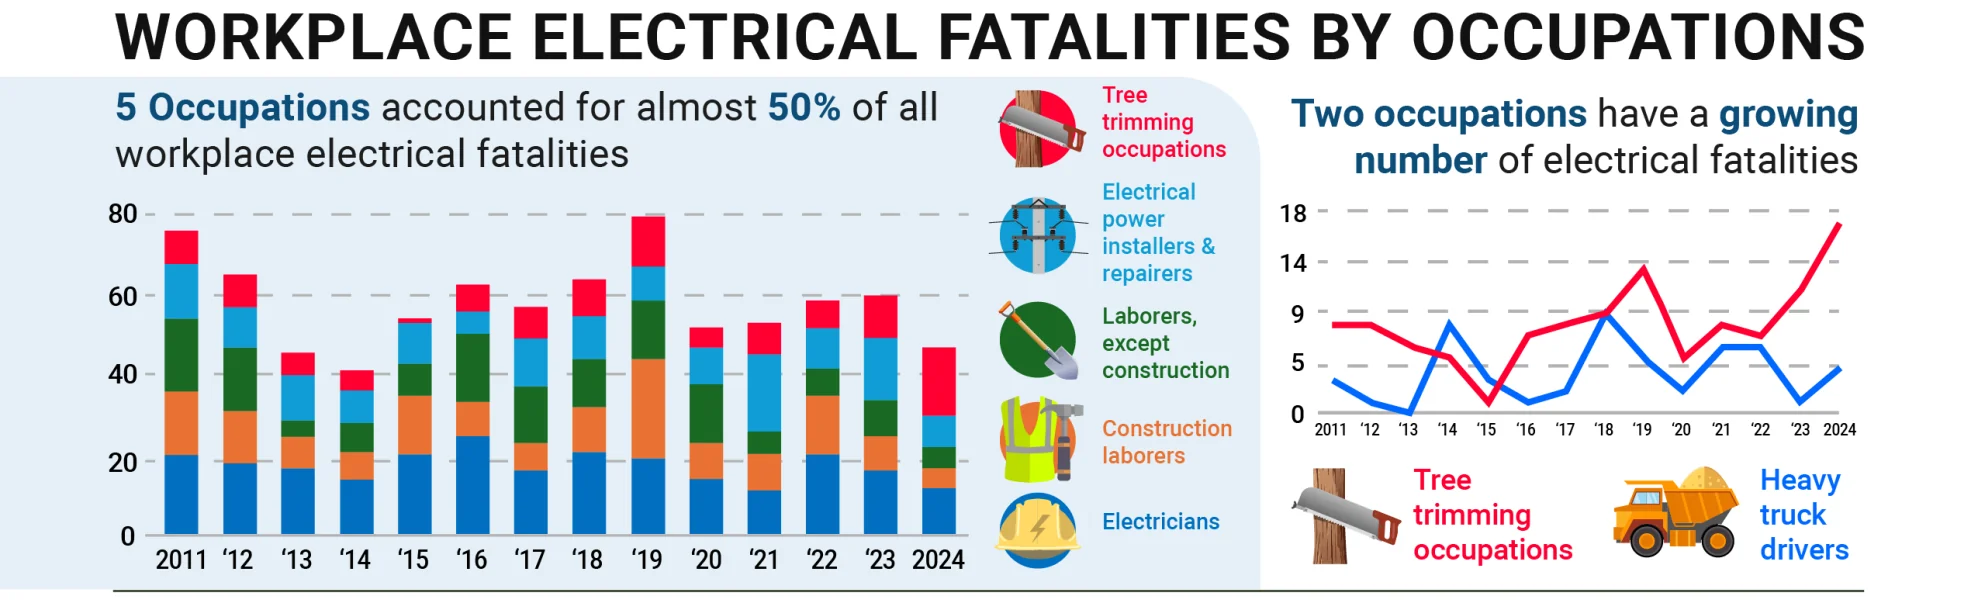
- Electricians, construction laborers, roofers, painters and carpenters together took 30% of all electrical deaths (ESFI, Mar 2026).
- Electrical occupations accounted for 444 of the deaths in OSHA fatality reports from 2011 to 2024, against 1,163 in non-electrical occupations (ESFI, Mar 2026).
- In 2020, 44% of fatal electrical victims worked in construction and extraction occupations and 20% in installation, maintenance and repair (NFPA, May 2022).
- Building and grounds cleaning and maintenance workers made up 13% of the 2020 victims (NFPA, May 2022).
How dangerous is the electrical trade itself?
BLS publishes death totals for electricians and electrical contractors across all causes, so the share caused by electricity cannot be read from these tables.
- BLS counted 53 work deaths of any cause among electricians in 2024, a rate of 5.3 per 100,000 full-time workers (BLS, Feb 2026).
- Electrical contractors had 59 work deaths of any cause in 2024 (BLS, Feb 2026).
- Falls, slips and trips caused 17 of those 59 deaths (BLS, Feb 2026).
- Nonresidential electrical contractors had 11 deaths and residential electrical contractors 7 (BLS, Feb 2026).
- Electricians had 75 work deaths of any cause in 2022 (BLS, Dec 2023).
- Among electrical contractors, exposure to electricity caused 50% of fatal cases in OSHA’s fatality and catastrophe database for 2007 to 2013 (International Journal of Environmental Research and Public Health, May 2021).
- Researchers coded more than 600 OSHA-reported incidents at electrical contractors for that study (International Journal of Environmental Research and Public Health, May 2021).
- A review of 132 NIOSH fatality investigations of electrical deaths in construction covered the years 1989 to 2010 (International Journal of Injury Control and Safety Promotion, Sep 2013).
How Common Are Electrical Injuries That Do Not Kill?
Nonfatal electrical injuries are far more common than deaths, and they swing more from year to year because they come from an employer survey. The survey misses the self-employed, so the counts are a floor.
How many nonfatal electrical injuries do workers report?
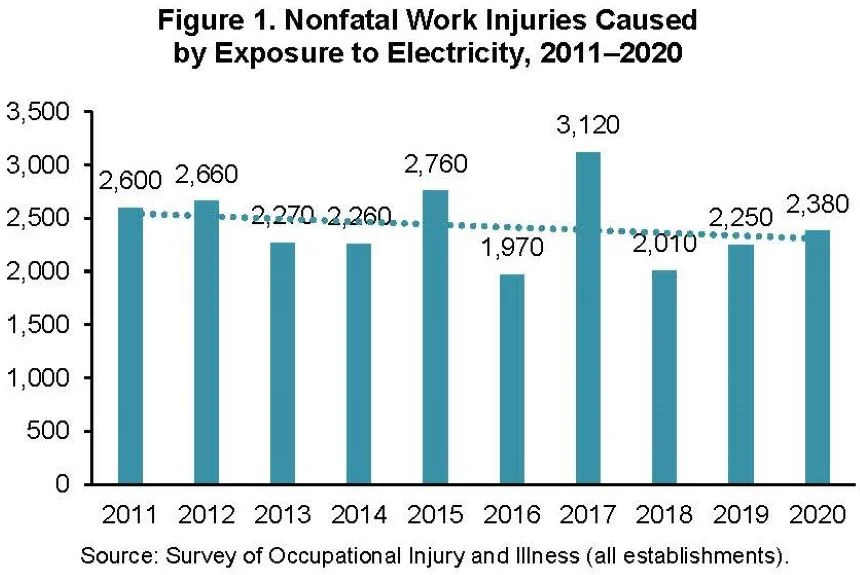
- Workers suffered 2,380 nonfatal injuries from exposure to electricity in 2020, about 46 a week (NFPA, May 2022).
- That was a 6% rise from 2,250 in 2019 (NFPA, May 2022).
- The 2017 count of 3,120 was the high of the decade (NFPA, May 2022).
- The 2016 count of 1,970 was the low (NFPA, May 2022).
- Employers reported 3,260 injuries with days away from work in 2021 and 2022 combined, a 21% drop from the two years before (ESFI, Mar 2026).
- Electricity accounted for 0.23% of all nonfatal injuries with days away from work in 2023 and 2024, against 0.11% in 2021 and 2022 (ESFI, Mar 2026).
- Median days away from work for 2021 and 2022 was 5 (ESFI, Mar 2026).
- All industries together had 19.9 thousand nonfatal electrical injuries from 2011 to 2020, and construction had 24.4% of them (CPWR, Nov 2022).
Who gets hurt and how badly?
- 72% of the 2020 nonfatal victims were men (NFPA, May 2022).
- Three quarters were 44 years old or younger, and 21% were aged 20 to 24 (NFPA, May 2022).
- 24% had worked for their employer less than three months (NFPA, May 2022).
- 85% were hurt by direct exposure to electricity (NFPA, May 2022).
- Parts and materials were the source of injury in 57% of cases (NFPA, May 2022).
- Installation, maintenance and repair workers had 15.6 nonfatal electrical injuries per 100,000 workers, the highest rate of any occupation group (NFPA, May 2022).
- Construction and extraction workers had a rate of 6.2 per 100,000 (NFPA, May 2022).
- 27% of cases kept the worker home one day, and 21% kept the worker home 31 days or more (NFPA, May 2022).
What happened to construction injuries over time?
- Nonfatal electrical injuries in private construction fell from 610 in 2011 to 440 in 2019 (CPWR, Nov 2022).
- The rate fell from 9.9 to 5.1 per 10,000 workers over the same years (CPWR, Nov 2022).
- Electrical burns in construction fell 55.8%, from 430 to 190, between 2011 and 2019 (CPWR, Nov 2022).
- Among electrical contractors, exposure to electricity caused 36% of nonfatal cases in the OSHA database (International Journal of Environmental Research and Public Health, May 2021).
How many adults end up in burn centers?
- The 2009 National Burn Repository held 2,837 adult electrical injury patients from multiple centers (Journal of Burn Care and Research, Sep 2012).
- Mean burn size in that group was 7% of body surface, against 4% at one urban burn center that treated 191 adults over eight years (Journal of Burn Care and Research, Sep 2012).
- Injuries in both groups were often work-related, and the common exposure sources were power plants and lines in the national data and domestic wiring at the single center (Journal of Burn Care and Research, Sep 2012).
What Do OSHA Electrical Statistics Show for Construction Sites?
Construction is where electrical deaths concentrate, and electrical citations there have fallen sharply. CPWR notes the decline fits a drop in the number of OSHA inspectors, which is its reading and not proof of cause.
How big is electrocution as a construction hazard?
- Almost half, 47.6%, of all work electrocutions in 2019 happened to construction workers, who are 7% of the workforce (CPWR, Nov 2022).
- Electrocutions made up 7.1% of fatal injuries in construction that year (CPWR, Nov 2022).
- Construction had 737 of the 1,501 fatal occupational electrical injuries from 2011 to 2020, or 49.1% (CPWR, Nov 2022).
- Electrocutions averaged 74 deaths a year in construction from 2011 to 2021 (CPWR, Mar 2023).
- Construction electrocutions fell from 79 in 2019 to 54 in 2020, then rose to 75 in 2021 (CPWR, Mar 2023).
- In 2015, 61% of all US workplace electrocutions happened in construction, 82 of 134 deaths (NIOSH, Feb 2019).
- Construction workers were about four times more likely to be electrocuted than workers in all other industries combined (NIOSH, Feb 2019).
- Construction electrocutions fell from 134 deaths in 2003 to 82 in 2015, and the rate fell from 1.3 to 0.8 per 100,000 workers (NIOSH, Feb 2019).
- Electrocution is one of the Focus Four construction hazards, which caused 65.5% of about 10.7 thousand construction deaths from 2011 to 2021 (CPWR, Mar 2023).
- 77% of the 325 contract worker electrocutions from 2012 to 2016 involved construction workers (NIOSH, Feb 2019).
How many OSHA citations cover electrical standards?
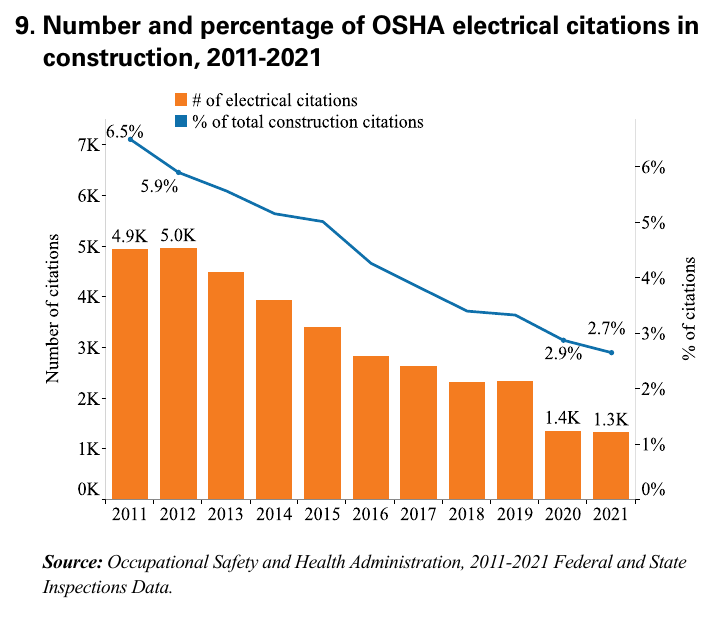
OSHA electrical citations in construction fell by almost three quarters between 2011 and 2021, and their share of all construction citations fell with them.
- OSHA electrical citations in construction fell from 4.9 thousand in 2011 to 1.3 thousand in 2021 (CPWR, Nov 2022).
- Their share of all construction citations fell from 6.5% to 2.7% (CPWR, Nov 2022).
- OSHA penalties for electrical standards in construction averaged $3.2 million a year from 2011 to 2021 (CPWR, Nov 2022).
- Yearly penalties fell 57.8%, from $4.5 million in 2011 to $1.9 million in 2021 (CPWR, Nov 2022).
- Specialty trade contractors received 70.5% of the electrical citations, building construction 26.1% and heavy and civil engineering 3.4% (CPWR, Nov 2022).
- Firms with fewer than 10 employees were 81.4% of establishments in 2020 but received 71.5% of electrical citations (CPWR, Nov 2022).
- Firms with more than 10 employees were 18.5% of establishments and received 28.5% of electrical citations (CPWR, Nov 2022).
What does a violation cost now?
- The OSHA maximum for a serious violation is $16,550 per violation (OSHA, May 2026).
- The minimum penalty for a willful violation is $11,823 (OSHA, May 2026).
- OSHA applied no inflation increase to penalties for 2026, so the 2025 amounts stay in effect (OSHA, May 2026).
What voltage and tasks lead to construction deaths?
- 58.8% of fatal electrical injuries in construction from 2011 to 2018 were direct exposures and 38.9% were indirect (CPWR, Nov 2022).
- 65.0% of direct and 87.4% of indirect fatal exposures involved more than 220 volts (CPWR, Nov 2022).
- CPWR researchers identified 10 high-risk electrical tasks, including pulling cable and working on energized equipment (CPWR, Nov 2022).
- Direct exposure to electricity was 67.6% of private construction electrocutions in 2021 (CPWR, Mar 2023).
How Many People Die From Electric Shock at Home?
Home deaths are not a work problem. They involve ordinary products, wiring and hobbies, and they fall mostly on men, with the highest rate at ages 45 to 64.
Where do consumer product deaths happen?
- CPSC held 139 death certificates with a residential location out of 276 in 2018 (CPSC, Nov 2023).
- It held 132 of 283 in 2019 (CPSC, Nov 2023).
- It held 122 of 256 in 2020 (CPSC, Nov 2023).
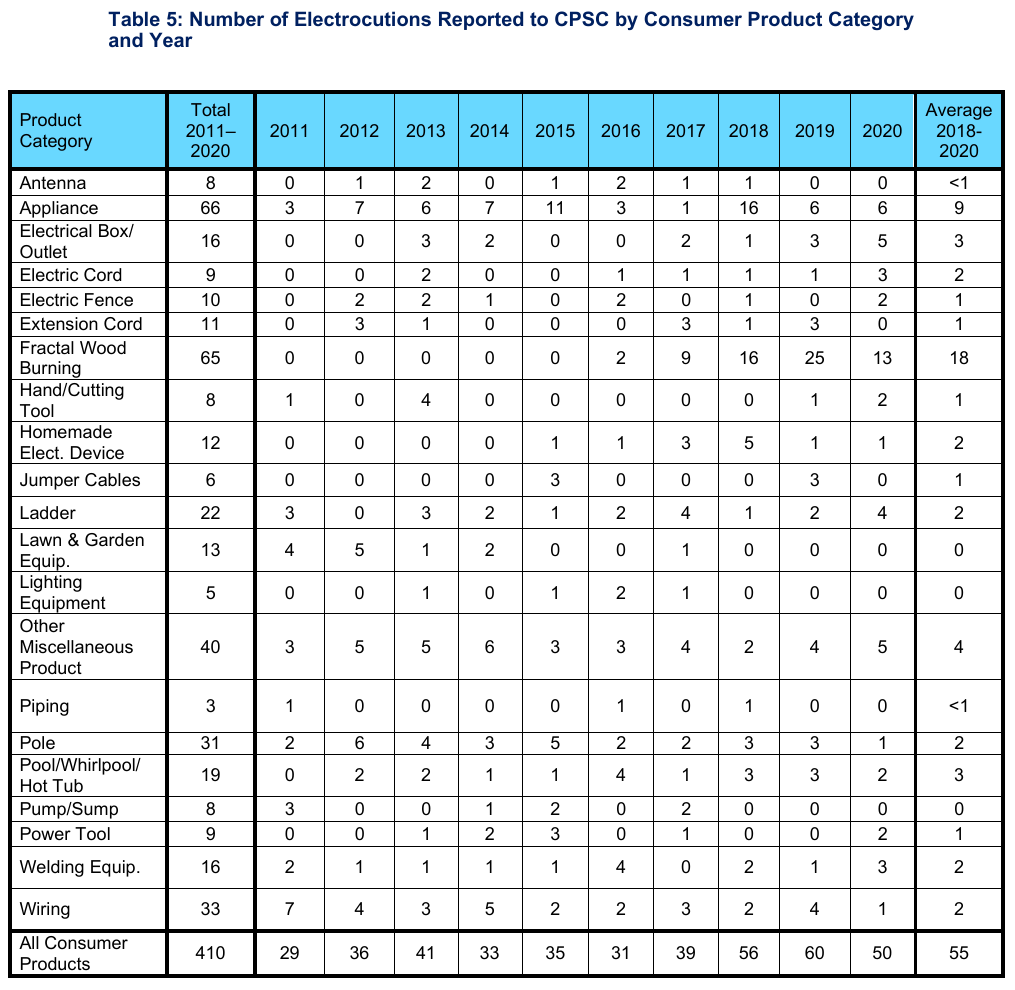
- CPSC counted 410 in-scope electrocutions by named product between 2011 and 2020 (CPSC, Nov 2023).
Which products are involved?
- Appliances were named in 66 deaths from 2011 to 2020 (CPSC, Nov 2023).
- Wiring was named in 33 deaths (CPSC, Nov 2023).
- Poles were named in 31 deaths and ladders in 22 (CPSC, Nov 2023).
- Pools, whirlpools and hot tubs were named in 19 deaths (CPSC, Nov 2023).
- Electrical boxes and outlets were named in 16 deaths and welding equipment in 16 (CPSC, Nov 2023).
- Extension cords were named in 11 deaths, electric fences in 10 and other electric cords in 9 (CPSC, Nov 2023).
- Fractal wood burning claimed 25 lives in 2019 alone (CPSC, Nov 2023).
- A third of the reports CPSC received from 2018 to 2020 mentioned wood burning explicitly (CPSC, Nov 2023).
Who dies from consumer product electrocution?
- An estimated 638 men and 79 women died from 2011 to 2020 (CPSC, Nov 2023).
- Victims aged 18 to 44 accounted for 277 deaths, 45 to 64 for 262 and 65 and over for 100 (CPSC, Nov 2023).
- The 45 to 64 group had a death rate of 0.454 per million from 2018 to 2020 (CPSC, Nov 2023).
- Non-Hispanic white victims were 74.1% of cases with a known race, against 61.5% of the US population (CPSC, Nov 2023).
What do ground-fault rules have to do with it?
A ground-fault circuit interrupter cuts power when current leaks to ground. The National Electrical Code (NFPA 70) added GFCI rules place by place over several decades, as CPSC lists below.
- A GFCI trips when the current out and the current back differ by as little as 0.006 amperes (CPSC, Sep 2010).
- National Electrical Code GFCI rules covered underwater pool lighting in 1968 and outdoor receptacles in 1973 (CPSC, Sep 2010).
- Bathrooms were added in 1975, garages in 1978 and kitchens in 1987 (CPSC, Sep 2010).
- Crawl spaces and unfinished basements were added in 1990 and wet bar sinks in 1993 (CPSC, Sep 2010).
- Laundry and utility sinks were added in 2005 (CPSC, Sep 2010).
Equipment grounding also matters for shock paths. The free equipment grounding conductor calculator and circuit ampacity calculator help check sizes, but the adopted code year and the local authority decide what applies to a job.
How Many Children Die or Get Hurt From Electrical Injuries?
Children die of electric shock less often than adults, and the data show it. Their injuries are more likely to be burns to the mouth and hands than deaths.
How many children die from electric shock?
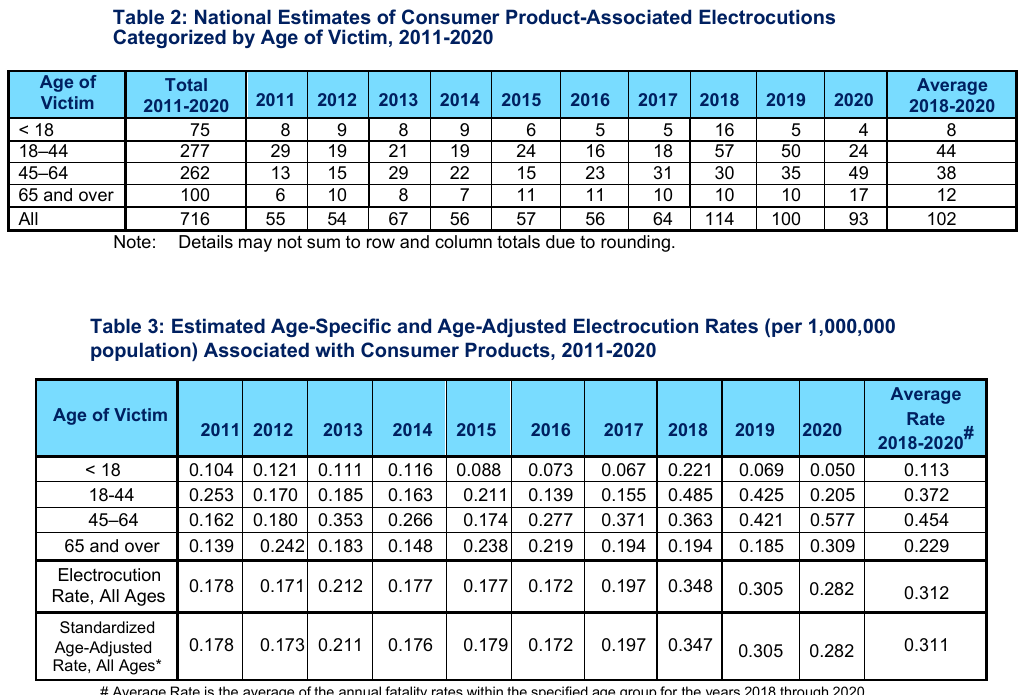
- An estimated 75 people under 18 died from consumer product electrocution from 2011 to 2020 (CPSC, Nov 2023).
- The yearly estimate peaked at 16 in 2018 and fell to 4 in 2020 (CPSC, Nov 2023).
- The death rate for children averaged 0.113 per million from 2018 to 2020 (CPSC, Nov 2023).
- The 2018 child rate was 0.221 per million and the 2020 rate was 0.050 (CPSC, Nov 2023).
- Adults aged 18 to 44 had a rate more than three times higher than children (CPSC, Nov 2023).
- Adults aged 65 and over had more than twice the child rate (CPSC, Nov 2023).
How many young children visit the emergency room with electrical burns?
- Emergency rooms treated an average of about 65.1 children a year for oral electrical burns from 1997 to 2012 (Otolaryngology-Head and Neck Surgery, Jul 2016).
- Nearly half of the patients were under 3 years old, and more than three quarters were under 5 (Otolaryngology-Head and Neck Surgery, Jul 2016).
- 59.6% of the patients were boys (Otolaryngology-Head and Neck Surgery, Jul 2016).
- 77.2% were treated and released, and 19.2% were admitted to the hospital (Otolaryngology-Head and Neck Surgery, Jul 2016).
- Electrical wires were involved in 21.5% of visits, extension cords in 18.5% and outlets or receptacles in 10.8% (Otolaryngology-Head and Neck Surgery, Jul 2016).
- The authors found that yearly incidence was lower than earlier estimates in the literature (Otolaryngology-Head and Neck Surgery, Jul 2016).
What do severe pediatric electrical burns look like?
- A Boston pediatric burn center treated 68 patients aged 0 to 18 with electrical burns from 2005 to 2018 (Burns, Nov 2020).
- 81% of the US patients had low-voltage burns, while 95% of the international patients had high-voltage burns (Burns, Nov 2020).
- The authors saw a drop in US pediatric high-voltage injuries over two decades and said it was likely due to better electrical safety (Burns, Nov 2020).
Methodology and Sources
For related topics, see the pages on power line death statistics, electrician statistics and electrical fire statistics.
Every figure comes from the agency, research group or journal that produced it, with the report date and a link to the report. Where one group repackages another’s data, such as ESFI on BLS and OSHA records, the page says so. Counts are not comparable across sources, because CPSC counts non-work consumer product deaths, BLS counts work deaths of any cause, and the National Center for Health Statistics counts every death certificate. Some figures are small survey or sample estimates and some use older data, which is stated in the text. This page is reviewed monthly and updated when a source publishes a new release.
Glossary
- BLS: Bureau of Labor Statistics, the federal agency that publishes work injury counts.
- CFOI: Census of Fatal Occupational Injuries, the BLS count of work deaths.
- SOII: Survey of Occupational Injuries and Illnesses, the BLS employer survey of nonfatal injuries.
- CPSC: Consumer Product Safety Commission.
- NCHS: National Center for Health Statistics, which compiles US death certificates.
- CPWR: The Center for Construction Research and Training.
- ESFI: Electrical Safety Foundation International.
- NFPA: National Fire Protection Association, which publishes the National Electrical Code (NFPA 70).
- NIOSH: National Institute for Occupational Safety and Health.
- OSHA: Occupational Safety and Health Administration.
- GFCI: Ground-fault circuit interrupter, a device that cuts power when current leaks to ground.
- Focus Four: OSHA’s four leading construction hazards: falls, struck-by, caught-in or between, and electrocution.
Sources
- BLS, Census of Fatal Occupational Injuries 2024 news release
- BLS, Table A-9, fatal occupational injuries by event or exposure, 2024
- BLS, Table A-9, 2022
- BLS, Table A-9, 2021
- BLS, Census of Fatal Occupational Injuries 2019 news release
- BLS, Table A-1, fatal occupational injuries by industry, 2024
- BLS, Table A-5, fatal occupational injuries by occupation, 2022
- BLS, Rate and number of fatal work injuries in selected occupations, 2024
- CPSC, Electrocutions Associated With Consumer Products 2011-2020
- CPSC, GFCI Fact Sheet
- ESFI, Workplace Injury and Fatality Statistics
- NFPA Research, Fatal Work Injuries Caused by Exposure to Electricity in 2020
- NFPA Research, Nonfatal Work Injuries Caused by Exposure to Electricity in 2020
- CPWR, Electrical Injuries and Citations in Construction, Data Bulletin
- CPWR, Fatal and Nonfatal Focus Four Injuries in Construction, Data Bulletin
- NIOSH Science Bulletin, Preventing Electrocution of Construction Contract Workers
- OSHA, 2026 Annual Adjustments to OSHA Civil Penalties
- Pediatric Oral Electrical Burns: Incidence of Emergency Department Visits in the United States, 1997-2012
- Surgical management and epidemiological trends of pediatric electrical burns
- Trends in Catastrophic Occupational Incidents among Electrical Contractors, 2007-2013
- Comparing a single institution’s experience with electrical injuries to the National Burn Repository
- Electrical deaths in the US construction: an analysis of fatality investigations
Cite this page
Every figure links to the source that published it. Quote one with a link to this page or to the source.
WireGaugeCalc. "158 Electrocution Statistics October 2026." WireGaugeCalc, October 2026. https://www.wiregaugecalc.com/statistics/electrocution-statistics/ <a href="https://www.wiregaugecalc.com/statistics/electrocution-statistics/">Electrocution Statistics</a> (WireGaugeCalc, October 2026)