 WireGaugeCalc
125 Power Outage Statistics October 2026
On this page
- How Often Do Power Outages Happen in the US?
- How Long Does the Average US Power Outage Last?
- Which States Have the Most Power Outages?
- What Causes Power Outages?
- How Bad Are Outages During Hurricanes and Winter Storms?
- How Do Outages Disrupt Households?
- Who Is Most at Risk When the Power Fails?
- How Much Do Power Outages Cost?
- How Safe Is Home Backup Power?
- Methodology and Sources
- Glossary
- Sources
Power outage statistics show a grid that works on most days and fails hard on a few. In a normal year the average customer loses power for a short time. One hurricane or cold snap can add days, and the damage lands on the same homes, the same states and the same people who depend on electric medical gear.
Every figure on this page comes from the agency, lab or regulator that produced it: the Energy Information Administration, the Department of Energy, the Census Bureau, national laboratories, NERC, FERC, the Consumer Product Safety Commission and state or federal health agencies. Each number carries its source and date. Where two sources measure the same thing differently, both are named.
Electricians see these numbers up close. Standby generators, transfer switches, service upgrades and panel load checks follow every big outage. Utilities report outages with three indexes. SAIDI is minutes without power per customer per year. SAIFI is interruptions per customer per year. CAIDI is minutes per interruption. Utilities report each index with and without “major events,” days when outages pass a set threshold.
Key Takeaways
- About 33.9 million US households, or 1 in 4, were completely without power at least once in the 12 months before the 2023 American Housing Survey (U.S. Census Bureau, Oct 2024).
- The average US customer lost power for 11 hours in 2024, nearly twice the annual average of the decade before (EIA, Dec 2025).
- South Carolina customers lost power for nearly 53 hours in 2024, the longest of any state (EIA, Dec 2025).
- Major outages cost US customers $121 billion in 2024, up from an average of more than $67 billion a year across 2018 to 2024 (Oak Ridge National Laboratory, Mar 2026).
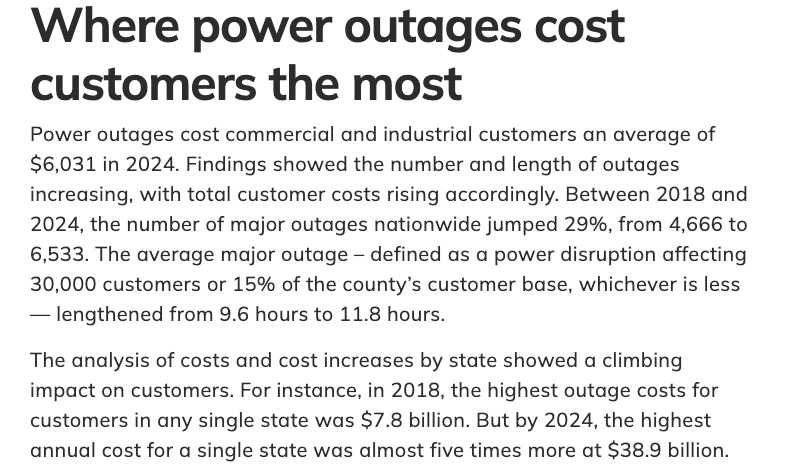
- The average major outage grew from 9.6 hours in 2018 to 11.8 hours in 2024 (Oak Ridge National Laboratory, Mar 2026).
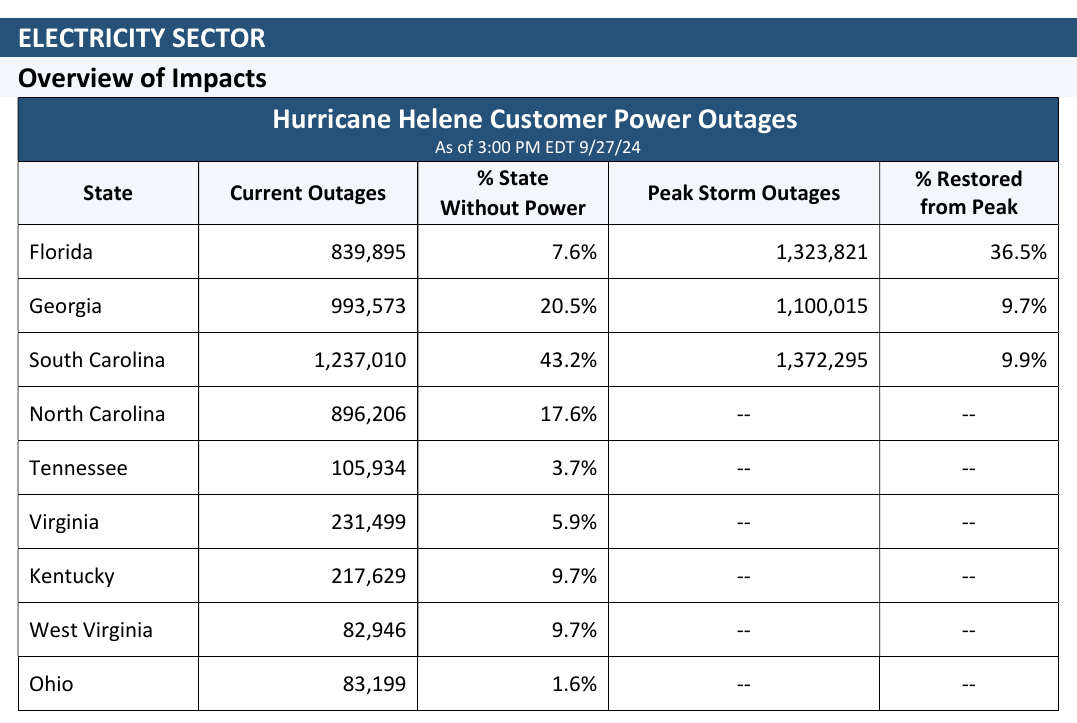
- Hurricane Helene left 4.68 million customers without power on September 27, 2024 (U.S. Department of Energy, Sep 2024).
- ERCOT ordered 20,000 MW of rolling blackouts in Winter Storm Uri, the largest manually controlled load shed in US history (FERC, Nov 2021).
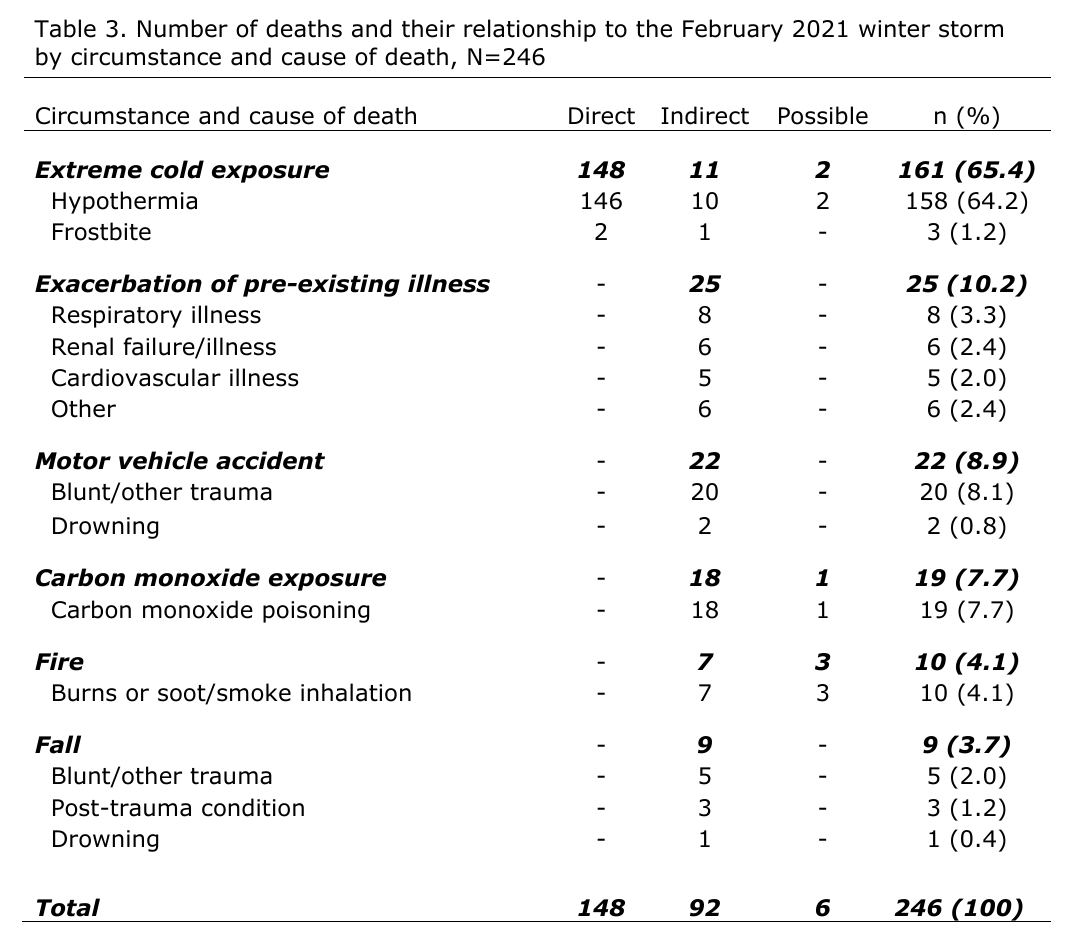
- Texas confirmed 246 deaths as related to the February 2021 winter storm (Texas DSHS, Dec 2021).
- More than 4.6 million Medicare beneficiaries who live independently rely on electricity-dependent equipment or services (HHS emPOWER, Oct 2026).
- Generators were linked to an estimated 102 carbon monoxide deaths in 2021 (CPSC, Feb 2025).
- NOAA counted 27 separate billion-dollar weather and climate disasters in 2024, the second-highest annual count in its 45-year record (NOAA NCEI, Jan 2025).
- A 14-day outage could cut the gross domestic product of ComEd’s service territory by $15.2 billion, or 10.4% (Lawrence Berkeley National Laboratory, Jun 2025).
How Often Do Power Outages Happen in the US?
Outages reach a large share of homes every year, and the odds swing with where you live and whether you own the house. The grid average hides that spread.
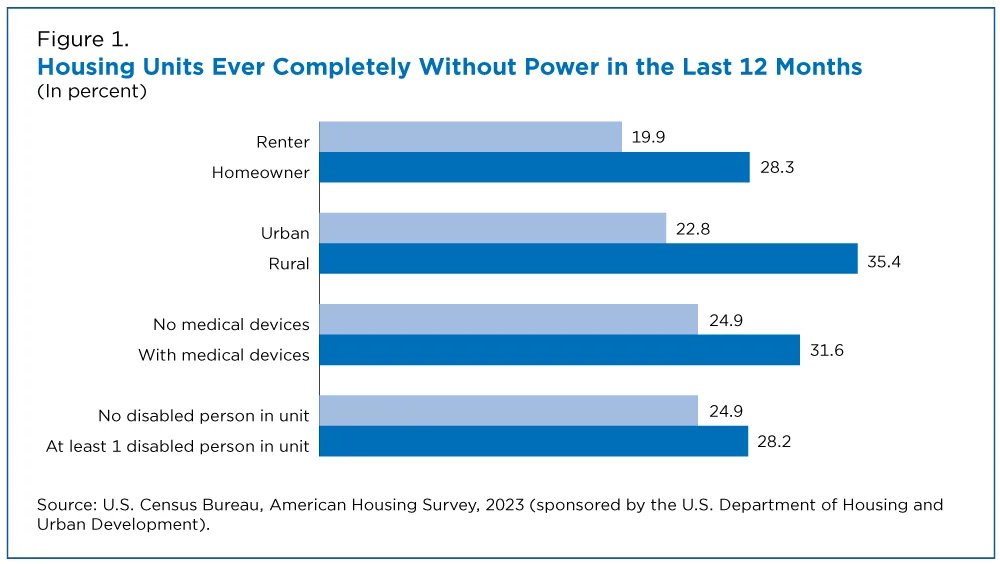
How many households lose power in a year?
- Of the households that had an outage, about 70%, or 23.6 million, said at least one outage lasted 6 hours or more (U.S. Census Bureau, Oct 2024).
- Homeowners reported outages more often than renters, 28.3% against 19.9% (U.S. Census Bureau, Oct 2024).
- Rural households reported outages at 35.4%, against 22.8% for urban households (U.S. Census Bureau, Oct 2024).
- Detroit was the hardest hit of the 15 largest metro areas at 44.8% of households, ahead of San Francisco at 36.3% and Seattle at 29.3% (U.S. Census Bureau, Oct 2024).
- Miami had the lowest share at 5.8% of households, and New York was second lowest at 11.2% (U.S. Census Bureau, Oct 2024).
How many interruptions does the average customer have?
- Using the IEEE method, the US averaged 1.531 interruptions per customer in 2024, up from 1.257 in 2014 (EIA, Oct 2025).
- With major event days removed, the figure was 1.065 in 2024 and 1.038 in 2014, so routine outages have barely changed (EIA, Oct 2025).
- A Berkeley Lab study of 13 years of data from 195 utilities, about 70% of US electricity sales, found a statistically significant rise in interruption duration, especially when major events are included (Lawrence Berkeley National Laboratory, Aug 2015).
- The very largest events, the ones that trigger emergency reports to federal agencies, are thought to be no more than 10% of the interruptions customers experience each year (Lawrence Berkeley National Laboratory, Aug 2015).
How are outages tracked?
- DOE’s EAGLE-I platform drew on 456 utilities and 146 million customers, or 92% of US electric customers, by 2022 (Scientific Data, Mar 2024).
- It reports outages every 15 minutes for 3,044 of 3,226 US counties and county equivalents (Scientific Data, Mar 2024).
- EAGLE-I was created after the 2003 Northeast blackout, which left as many as 50 million people without power for up to four days (Oak Ridge National Laboratory, May 2024).
- Utilities must file a federal DOE-417 report when more than 50,000 customers lose service for an hour or more (Lawrence Berkeley National Laboratory, Aug 2023).
How Long Does the Average US Power Outage Last?
Outage time is set by a few storm years. Strip those out and the number hardly moves.
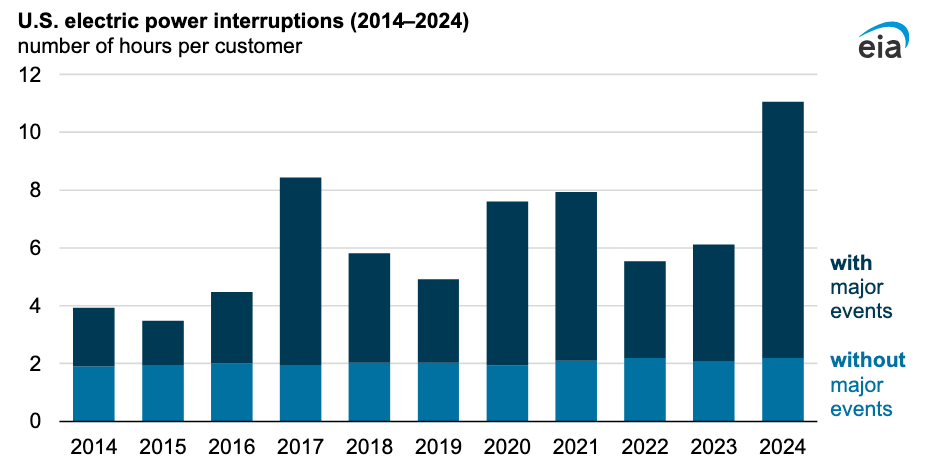
How many hours without power does a customer lose each year?
- Hurricanes Beryl, Helene and Milton accounted for 80% of the hours without electricity in 2024 (EIA, Dec 2025).
- Interruptions tied to major events averaged nearly nine hours in 2024, against nearly four hours a year from 2014 to 2023 (EIA, Dec 2025).
- Interruptions not triggered by major events routinely average about two hours a year (EIA, Dec 2025).
- Without major event days, SAIDI was 131.6 minutes in 2024, against 114.2 minutes in 2014 (EIA, Oct 2025).
- Before 2024, the worst year in the table was 2017 at 505.9 minutes of SAIDI with major event days (EIA, Oct 2025).
- In 2022 customers averaged about five and one-half hours of interruptions, almost two hours less than in 2021 (EIA, Jan 2024).
- In 2020 customers averaged just over eight hours, the most since EIA began collecting reliability data in 2013 (EIA, Nov 2021).
How long does each outage last?
- The average interruption lasted 432.7 minutes in 2024, against 188 minutes in 2014 (EIA, Oct 2025).
- Oak Ridge defines a major outage as one that hits 30,000 customers or 15% of a county’s customers, whichever is less (Oak Ridge National Laboratory, Mar 2026).
Which States Have the Most Power Outages?
Storm paths decide the state rankings, and the order reshuffles every year. A state near the bottom one year can lead the next.
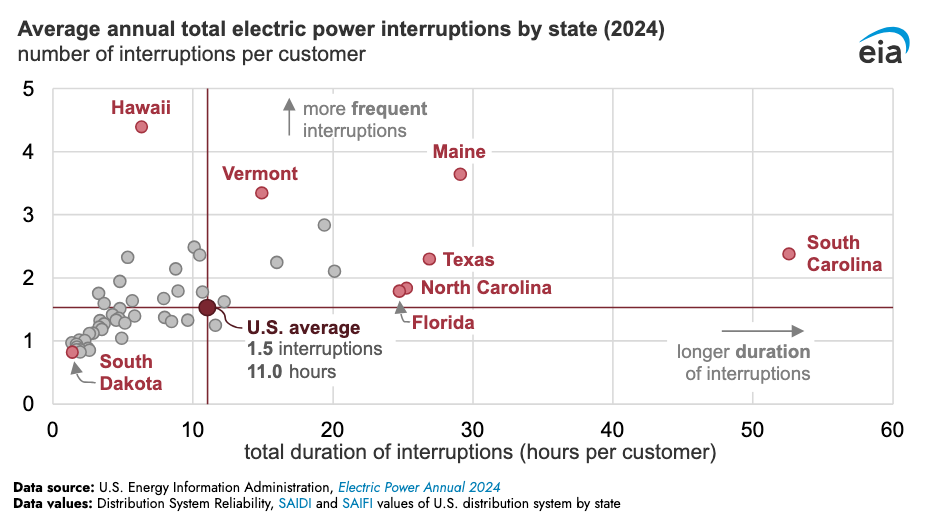
Which states have the longest outages?
- Maine averaged 1,748.6 minutes without power in 2024, about 29 hours and second only to South Carolina (EIA, Oct 2025).
- North Carolina averaged 1,441.0 minutes and Florida 1,321.5, after Hurricanes Helene and Milton (EIA, Oct 2025).
- Texas averaged 1,270.6 minutes and Georgia 1,229.1 (EIA, Oct 2025).
- The District of Columbia had the shortest time, 32.6 minutes, and South Dakota followed at 84.7 minutes (EIA, Oct 2025).
- Nebraska went from 72.6 minutes in 2023 to 641.7 minutes in 2024, a reminder that one storm can reorder the list (EIA, Oct 2025).
Which states have the most frequent outages?
- Hawaii had 4.4 interruptions per customer in 2024, the most of any state (EIA, Dec 2025).
- Maine averaged 3.636 interruptions and Vermont 2.516 (EIA, Oct 2025).
- West Virginia averaged 2.832 interruptions and Louisiana 2.722 (EIA, Oct 2025).
- South Dakota, Maryland, Illinois and Massachusetts each averaged fewer than one interruption (EIA, Dec 2025).
- Without major events, West Virginia still averaged 486.1 minutes without power, against 126.0 minutes for the US (EIA, Oct 2025).
How do US territories compare?
- Puerto Rico customers lost power for 27 hours a year from 2021 to 2024 without counting major events, against about two hours on the mainland (EIA, Aug 2025).
- In 2024 Puerto Rico customers went without electricity for more than 73 hours, 43 of them from major events such as Hurricane Ernesto (EIA, Aug 2025).
- Hurricane Fiona left all 1.5 million Puerto Rico customers without power in 2022, and the average customer lost almost 200 hours that year (EIA, Aug 2025).
- Puerto Rico customers averaged 36 hours of non-event interruptions in 2025, 19% more than in 2024 (EIA, Aug 2026).
- Interruption frequency in Puerto Rico has doubled since 2021, and a customer averaged almost 16 interruptions in 2025 (EIA, Aug 2026).
What Causes Power Outages?
Weather starts most large outages, but the wires that fail are almost always local ones. The two facts work together.
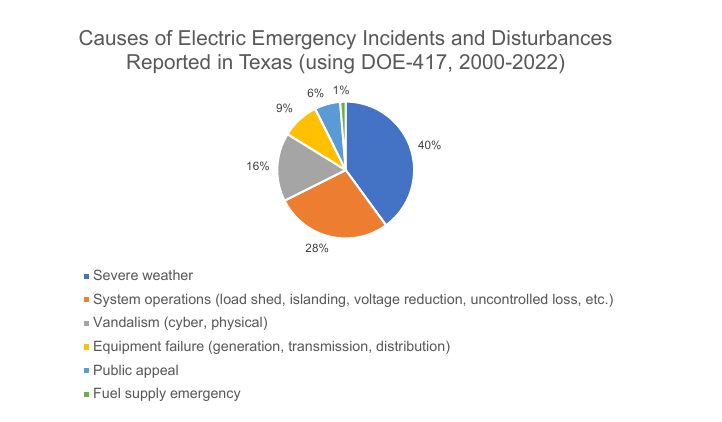
What share of outages come from severe weather?
- Severe weather made up 40% of Texas DOE-417 reports from 2000 to 2022, and system operations such as load shed made up 28% (Lawrence Berkeley National Laboratory, Aug 2023).
- Vandalism, cyber and physical, made up 16% of those reports, and equipment failure made up 9% (Lawrence Berkeley National Laboratory, Aug 2023).
- From 1980 to 2024 the US had 403 weather and climate disasters that each cost more than $1 billion, and they killed 16,941 people (NOAA NCEI, Jan 2025).
- Severe storms were the biggest group at 203 events, followed by 67 tropical cyclones (NOAA NCEI, Jan 2025).
- The annual average was 9.0 billion-dollar events across 1980 to 2024 and 23.0 across the latest five years (NOAA NCEI, Jan 2025).
- Only three of the 23 billion-dollar events in 2025 showed up in NERC’s Severity Risk Index, and NERC says weather had less impact on the bulk power system than in earlier years (NERC, Jun 2026).
Where on the grid do outages start?
- Using 2014 utility data, the distribution system accounts for at least 94% of outage minutes (SAIDI) and 92% of interruptions (SAIFI) (Lawrence Berkeley National Laboratory, Mar 2019).
- In Winter Storm Uri, freezing (44.2%) and fuel problems (31.4%) caused 75.6% of unplanned generating unit outages, derates and failures to start (FERC, Nov 2021).
- Of the freeze-related generator outages, 81% happened at temperatures above the units’ stated design temperature (FERC, Nov 2021).
- Of the fuel-related generator outages, 87% involved natural gas (FERC, Nov 2021).
Will demand growth raise outage risk?
- A DOE modeled scenario counts 104 GW of firm capacity set to retire by 2030 (U.S. Department of Energy, Jul 2025).
- In the same model, 209 GW of new generation replaces it, but only 22 GW is firm baseload (U.S. Department of Energy, Jul 2025).
- DOE’s plant closures scenario raised annual loss-of-load hours by a factor of 100 in 2030, and it reports a factor of 34 even with no retirements (U.S. Department of Energy, Jul 2025).
- NERC says load grew by 11 GW from summer 2025 to summer 2026, after 10 GW of growth in 2025 that doubled the 2023 to 2024 increase (NERC, May 2026).
- NERC found three regions and one locality at elevated summer risk in 2026, down from six regions in 2025 (NERC, May 2026).
How Bad Are Outages During Hurricanes and Winter Storms?
A few storms set the national numbers. Each one leaves millions of customers dark and tests how fast crews can move.
How many customers lose power in a hurricane?
- In Helene, South Carolina utilities reported 1,237,010 customers out, or 43.2% of the state, on September 27, 2024 (U.S. Department of Energy, Sep 2024).
- By October 5, Helene outages were down more than 87% from the regional peak of 4.6 million (U.S. Department of Energy, Oct 2024).
- Hurricane Milton cut power to a peak of 3,314,542 customers in Florida (U.S. Department of Energy, Oct 2024).
- More than 50,000 workers from at least 42 states, the District of Columbia and Canada joined the Milton response (U.S. Department of Energy, Oct 2024).
- Hurricane Ian left a peak of 2.7 million Florida customers without power, and outages were down 95% by October 7, 2022 (U.S. Department of Energy, Oct 2022).
- For Hurricanes Ida and Nicholas combined, the Louisiana peak was about 1,075,158 outages, and 98% had been restored by September 23, 2021 (U.S. Department of Energy, Sep 2021).
- Hurricane Beryl left 2.6 million Texas customers without power in July 2024 (EIA, Dec 2025).
What happened in the big winter grid failures?
- In Uri, more than 4.5 million people in Texas lost power, some for as long as four days (FERC, Nov 2021).
- February 15, 2021 scored 61.35 on NERC’s Severity Risk Index, the worst day in the 2021 to 2025 window (NERC, Jun 2026).
- Operators ran 71 hours of load shed in 2021 and none in 2025 (NERC, Jun 2026).
- Winter Storm Elliott in December 2022 left over 1.5 million customers without power in several states (EIA, Jan 2024).
- During Elliott, unplanned generation losses topped 70,000 MW, and southeastern operators ordered firm load shed above 5,000 MW (FERC, Jun 2023).
How active was the recent weather record?
- The 2024 tornado count of at least 1,735 was the second highest on record (NOAA NCEI, Jan 2025).
- Hurricane Helene was the seventh-most-costly Atlantic hurricane on record (NOAA NCEI, Jan 2025).
- Weather in 2025 was fairly temperate with no hurricane landfalls, and the cumulative Severity Risk Index was 496.0, against 536.4 in 2021 (NERC, Jun 2026).
How Do Outages Disrupt Households?
The cost shows up in the kitchen first: spoiled food, missed work and burst pipes. Most of it is avoidable only with backup power.
What goes wrong at home during an outage?
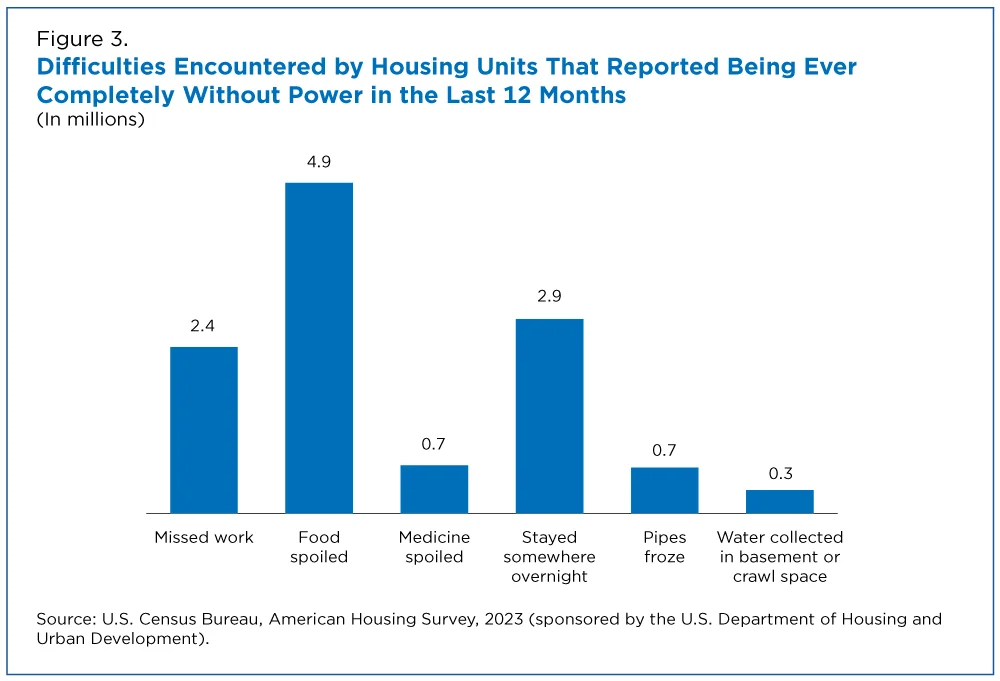
- About 14% of households with an outage, or 4.9 million housing units, had food spoil (U.S. Census Bureau, Oct 2024).
- FDA says an unopened refrigerator keeps food cold for about 4 hours (FDA, Mar 2024).
- A full freezer holds its temperature for about 48 hours, or 24 hours if half full (FDA, Mar 2024).
- About 2.4 million housing units had someone miss work, 7.9% of households that had an outage and a working member (U.S. Census Bureau, Oct 2024).
- About 705,000 households, or 2.9% of those with refrigerated medicine, lost medicine to spoilage (U.S. Census Bureau, Oct 2024).
- About 2.9 million households, or 8.4%, had to stay away from home overnight (U.S. Census Bureau, Oct 2024).
- Frozen pipes hit an estimated 673,000 housing units, and about 343,000 households had water collect in a basement or crawl space after a sump pump stopped (U.S. Census Bureau, Oct 2024).
Who Is Most at Risk When the Power Fails?
An outage is an inconvenience for most people and a medical event for a few. The data tracks who is in the second group.
How many people depend on electric medical equipment?
- Over 3 million Medicare beneficiaries rely on electricity-dependent durable medical and assistive equipment (HHS emPOWER, Oct 2026).
- Another group of over 2.8 million has a claim for dialysis, home oxygen, home health care or at-home hospice services (HHS emPOWER, Oct 2026).
- Around 14.5 million US households have medical devices that need electricity, and 31.6% of them had an outage (U.S. Census Bureau, Oct 2024).
- Of more than 30 million households with a person who has a disability, 28.2%, or 8.6 million, had an outage (U.S. Census Bureau, Oct 2024).
How many deaths follow a major grid failure?
- The 246 Uri deaths occurred across 77 Texas counties (Texas DSHS, Dec 2021).
- Extreme cold exposure caused 161 of them, or 65.4% (Texas DSHS, Dec 2021).
- Among the 158 hypothermia deaths, 107 (67.7%) were people aged 60 or older (Texas DSHS, Dec 2021).
- Another 25 deaths (10.2%) came from existing illness made worse, including lost dialysis, lost oxygen and loss of power for life-sustaining equipment (Texas DSHS, Dec 2021).
- Nineteen deaths (7.7%) were carbon monoxide poisoning from generators, grills, heaters and vehicles run in enclosed spaces (Texas DSHS, Dec 2021).
- Ten deaths (4.1%) were fire injuries, some from space heaters near ignitable materials (Texas DSHS, Dec 2021).
What did the hurricane death reviews find?
- CDC counted 129 Hurricane Irma deaths in Florida, Georgia and North Carolina (CDC, Aug 2018).
- Twenty of them (15.5%) were existing medical conditions made worse that could also be counted as power-outage deaths (CDC, Aug 2018).
- Fourteen heat-related deaths were older patients at one Florida assisted-living facility that lost power for several days (CDC, Aug 2018).
- Sixteen deaths (12.4%) were carbon monoxide poisonings among the outage-related deaths not tied to an existing condition (CDC, Aug 2018).
Who gets carbon monoxide poisoning during a cold-weather outage?
- Houston hospitals evaluated 78 patients for carbon monoxide exposure during Uri, 59 of them children (Journal of Pediatrics: Clinical Practice, Apr 2024).
- Charcoal grills brought indoors were the source for 61.5% of those patients, and generators running indoors for 7.7% (Journal of Pediatrics: Clinical Practice, Apr 2024).
- The census tracts those patients came from had a median Social Vulnerability Index of 0.65, against 0.51 for Greater Houston (Journal of Pediatrics: Clinical Practice, Apr 2024).
How Much Do Power Outages Cost?
Outage costs are large, uneven and rising. The newest national estimate is more than twice the older ones.
What do outages cost the US economy each year?
- Oak Ridge puts commercial and industrial losses at an average of $6,031 per customer in 2024 (Oak Ridge National Laboratory, Mar 2026).
- GAO reviewed one report that put the annual cost of outages to utility customers at roughly $55 billion for 2006 to 2019 and over roughly $480 billion for 2080 to 2099 without aggressive grid resilience measures (GAO, Mar 2021).
- Three reports GAO reviewed put the annual cost of weather-related outages between about $2 billion and about $77 billion, a spread that reflects what each study counts (GAO, Mar 2021).
- Berkeley Lab projected discounted cumulative customer costs of $1.5 to $3.4 trillion through mid-century without aggressive undergrounding (Lawrence Berkeley National Laboratory, Jan 2017).
Where do outages cost the most?
- The highest annual outage cost for any single state rose from $7.8 billion in 2018 to $38.9 billion in 2024 (Oak Ridge National Laboratory, Mar 2026).
- Texas had the highest total at more than $80 billion across the study period (Oak Ridge National Laboratory, Mar 2026).
- One rural South Carolina county topped the nation at almost $400 per household and $140,000 per non-residential customer for each outage (Oak Ridge National Laboratory, Mar 2026).
- The Dallas Fed estimated that the Uri freeze and outage could cost the Texas economy $80 billion to $130 billion (Dallas Fed, Apr 2021).
What does a long outage do to a regional economy?
- Berkeley Lab found that a one-day interruption would reduce ComEd territory GDP by $1.8 billion, or 1.3% (Lawrence Berkeley National Laboratory, Jun 2025).
- A three-day interruption would cost $3.7 billion, or 2.6% (Lawrence Berkeley National Laboratory, Jun 2025).
How Safe Is Home Backup Power?
A generator solves one problem and can create a deadly one. The federal death counts are the reason to site, size and wire a unit with care.

How common are home standby generators?
- Generac estimates about 6.75% penetration of the addressable market of US homes, which it defines as single-family detached, owner-occupied households with a home value over $175,000 (Generac, Feb 2026).
How many people die from generator carbon monoxide?
- CPSC estimated 227 unintentional non-fire carbon monoxide deaths a year on average from 2019 to 2021 (CPSC, Feb 2025).
- In 2021, 86% of the 204 estimated deaths came from exposure at a home location (CPSC, Feb 2025).
- Generators were 44% of consumer-product carbon monoxide deaths on average from 2019 to 2021 (CPSC, Feb 2025).
- Since 2009, portable generators alone were tied to an estimated 765 non-fire carbon monoxide deaths, 40% of the consumer-product total (CPSC, Mar 2023).
- Most generator deaths, 81%, occurred in residential locations, and the top reasons for use were weather-related outages, power shut-offs and powering temporary sites (CPSC, Aug 2022).
- African Americans make up about 12% of the US population but 22% of portable generator carbon monoxide deaths (CPSC, Feb 2022).
- Portable generators certified to PGMA G300-2018 and UL 2201 are estimated to cut carbon monoxide deaths by 87% and 100% (CPSC, Jan 2024).
Are permanent standby generators a risk too?
- After Hurricane Ida, CPSC received reports of 256 southeast Louisiana homes with at least one carbon monoxide exposure (CPSC, Jun 2025).
- Investigators traced the source to a stationary generator in 105 of those homes, and residents of 12 of the 105 had symptoms (CPSC, Jun 2025).
- A carbon monoxide alarm went off in 85 of the 105 homes (CPSC, Jun 2025).
- CPSC staff recommends that the NFPA 37 committee raise the separation between a stationary generator and openings into a building from 5 feet to at least 25 feet (CPSC, Jun 2025).
Sizing a unit starts with the loads you plan to back up. The home generator sizing calculator totals running and starting watts, and the residential load calculator helps check the panel. They are aids only. Confirm the install against the adopted code year and the local authority having jurisdiction.
For the fire side of backup heat and wiring, see the electrical fire statistics page.
Methodology and Sources
Each figure comes from the agency, laboratory, regulator or company that produced it, and every link goes to the source page or report. Reliability numbers are the EIA’s utility-reported SAIDI, SAIFI and CAIDI, which come in IEEE-method and any-method versions, so the page names the version where it matters. Cost and death estimates are reported as each source states them, and the sources do not always agree. Counts of customers out are peak or point-in-time readings from the dates shown. EIA will publish 2025 reliability data in its next Electric Power Annual, and this page is refreshed monthly as new releases appear.
Glossary
- SAIDI: System Average Interruption Duration Index, minutes without power per customer per year.
- SAIFI: System Average Interruption Frequency Index, interruptions per customer per year.
- CAIDI: Customer Average Interruption Duration Index, minutes per interruption.
- Major event: a day when a utility’s outage time passes a set threshold, usually from a storm.
- EAGLE-I: the DOE platform that tracks utility outages in near real time.
- DOE-417: the federal form utilities file for electric emergency incidents and disturbances.
- ERCOT: Electric Reliability Council of Texas, the grid operator for most of Texas.
- NERC: North American Electric Reliability Corporation.
- FERC: Federal Energy Regulatory Commission.
- CPSC: U.S. Consumer Product Safety Commission.
- Severity Risk Index: a NERC daily score of how much stress events put on the bulk power system.
Sources
- CDC, Aug 2018
- CPSC, Aug 2022
- CPSC, Feb 2022
- CPSC, Mar 2023
- CPSC, Jan 2024
- CPSC, Jun 2025
- CPSC, Feb 2025
- Dallas Fed, Apr 2021
- EIA, Oct 2025
- EIA, Oct 2025
- EIA, Nov 2021
- EIA, Jan 2024
- EIA, Aug 2025
- EIA, Dec 2025
- EIA, Aug 2026
- FDA, Mar 2024
- FERC, Nov 2021
- FERC, Jun 2023
- GAO, Mar 2021
- Generac, Feb 2026
- HHS emPOWER, Oct 2026
- Journal of Pediatrics: Clinical Practice, Apr 2024
- Lawrence Berkeley National Laboratory, Mar 2019
- Lawrence Berkeley National Laboratory, Aug 2015
- Lawrence Berkeley National Laboratory, Jan 2017
- Lawrence Berkeley National Laboratory, Aug 2023
- Lawrence Berkeley National Laboratory, Jun 2025
- NERC, May 2026
- NERC, Jun 2026
- NOAA NCEI, Jan 2025
- NOAA NCEI, Jan 2025
- Oak Ridge National Laboratory, Mar 2026
- Oak Ridge National Laboratory, May 2024
- Scientific Data, Mar 2024
- Texas DSHS, Dec 2021
- U.S. Census Bureau, Oct 2024
- U.S. Department of Energy, Oct 2024
- U.S. Department of Energy, Sep 2021
- U.S. Department of Energy, Oct 2022
- U.S. Department of Energy, Sep 2024
- U.S. Department of Energy, Oct 2024
- U.S. Department of Energy, Oct 2024
- U.S. Department of Energy, Jul 2025
Cite this page
Every figure links to the source that published it. Quote one with a link to this page or to the source.
WireGaugeCalc. "125 Power Outage Statistics October 2026." WireGaugeCalc, October 2026. https://www.wiregaugecalc.com/statistics/power-outage-statistics/ <a href="https://www.wiregaugecalc.com/statistics/power-outage-statistics/">Power Outage Statistics</a> (WireGaugeCalc, October 2026)