 WireGaugeCalc
133 Electrician Statistics October 2026
On this page
- How many electricians work in the United States?
- What does the Bureau of Labor Statistics say electricians earn?
- How fast will electrician jobs grow?
- Who works as an electrician?
- How do apprenticeships and state licenses work?
- Electrical Industry Statistics: How Big Is the Trade?
- Is there an electrician shortage?
- How safe is electrician work?
- Methodology and Sources
- Sources
- Glossary
Electrician statistics show a trade that is large, well paid and hard to staff. This page gathers the federal, state and industry numbers behind that claim, from the Bureau of Labor Statistics, the Census Bureau, the Department of Labor, state license boards and the contractors who hire.
Every figure comes from the agency or group that produced it, with the date of the data. Where two sources count the same workers in different ways, both counts are shown and the reason is given. The numbers describe workers and firms. They are not code advice, and local rules decide what any license or job requires.
Key Takeaways
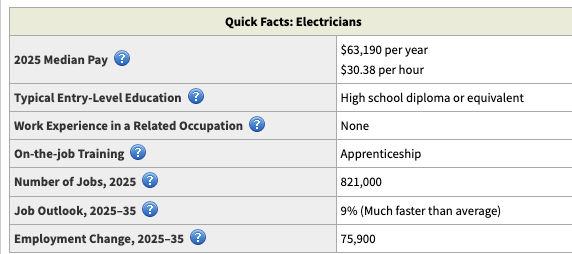
- Electricians held about 821,000 jobs in 2025. (BLS Occupational Outlook Handbook, Aug 2026)
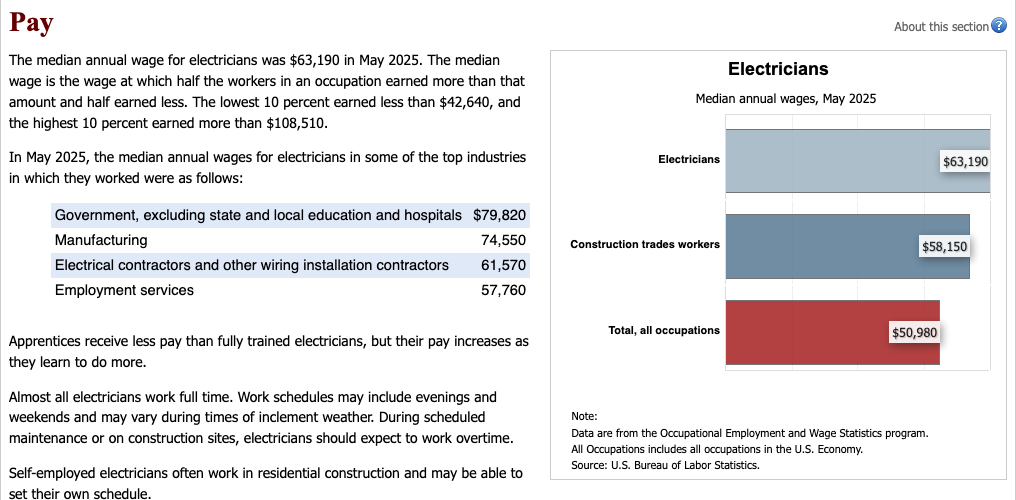
- The median electrician wage was $63,190 in May 2025, against $50,980 for all occupations. (BLS Occupational Outlook Handbook, Aug 2026)
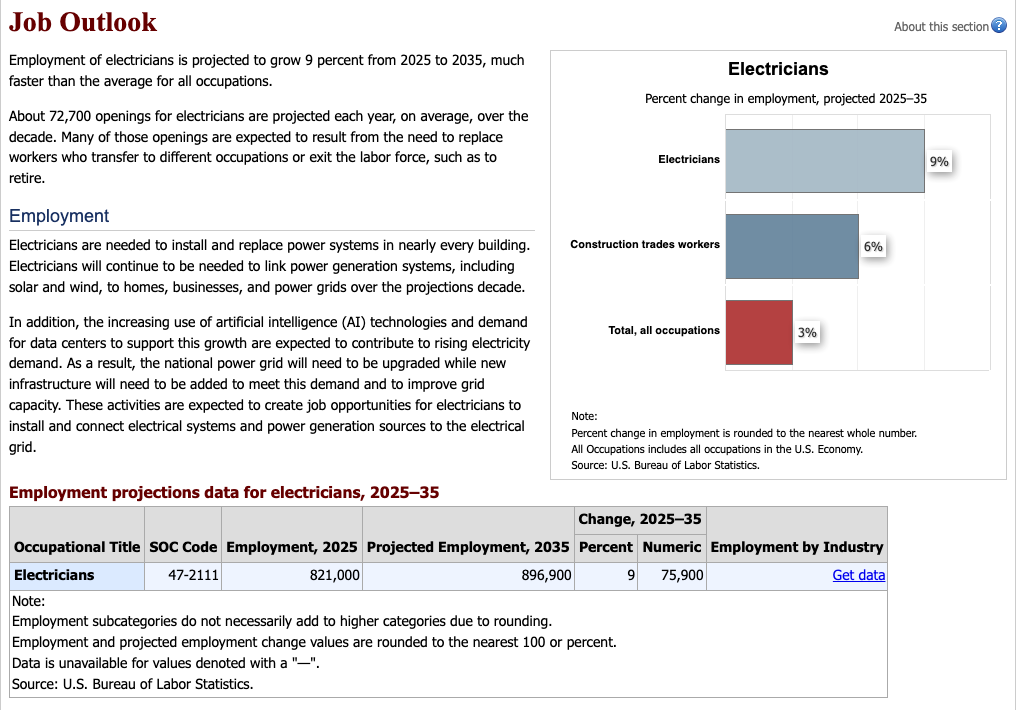
- Electrician employment is projected to grow 9 percent from 2025 to 2035. (BLS Occupational Outlook Handbook, Aug 2026)
- About 72,700 electrician openings a year are projected over the decade. (BLS Employment Projections, Aug 2026)
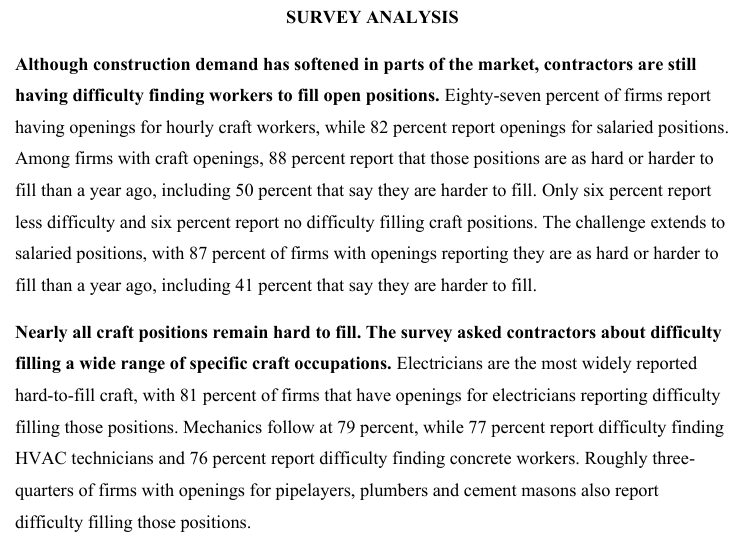
- Electricians are the most widely reported hard-to-fill craft: 81 percent of firms with electrician openings report difficulty filling them. (AGC and NCCER 2026 Workforce Survey, Sep 2026)
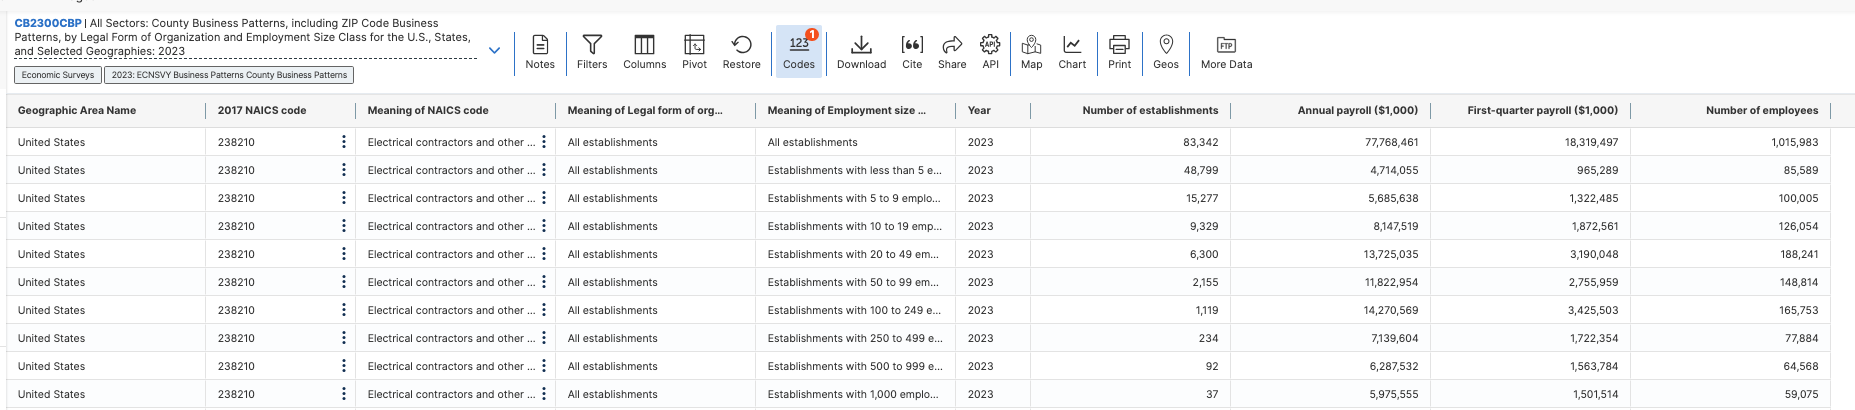
- Electrical contractors employed 1,015,983 people in 2023. (U.S. Census Bureau County Business Patterns, Jun 2025)
- Texas listed 40,318 journeyman electrician licenses that had not expired as of October 20, 2026. (Texas Department of Licensing and Regulation, Oct 2026)
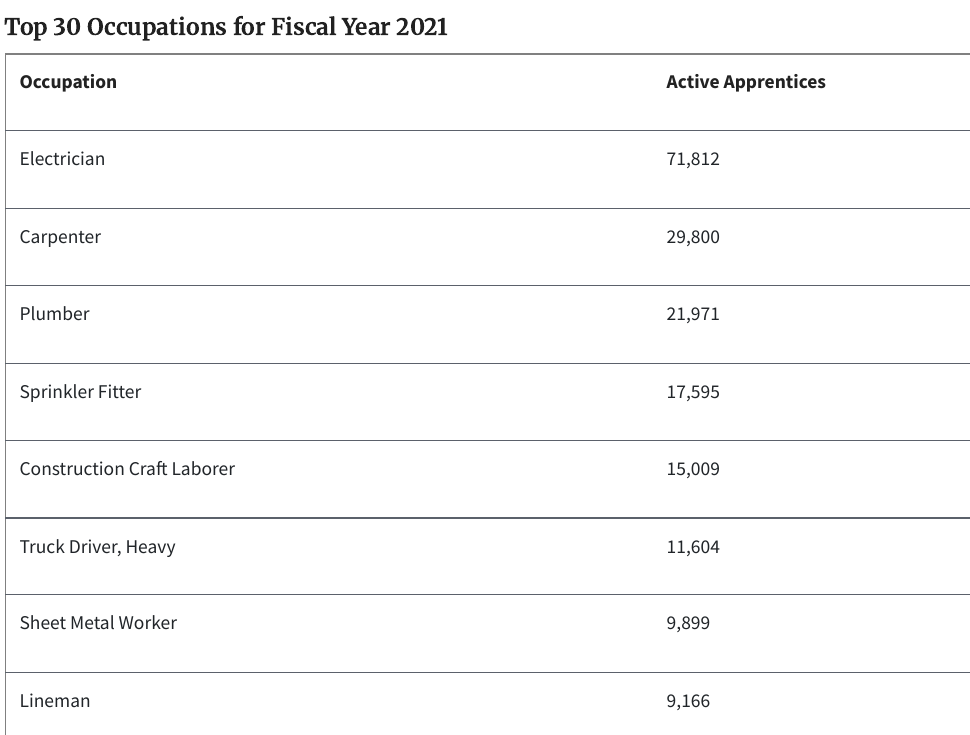
- Electrician was the top registered apprenticeship occupation in fiscal year 2021, with 71,812 active apprentices. (U.S. Department of Labor Office of Apprenticeship, Sep 2021)
- Oregon paid electricians the highest average annual wage in May 2025, $99,750. (BLS Occupational Employment and Wage Statistics, May 2025)
- 33.1 percent of construction electricians were union members in 2025. (CPWR Construction Chart Book, May 2026)
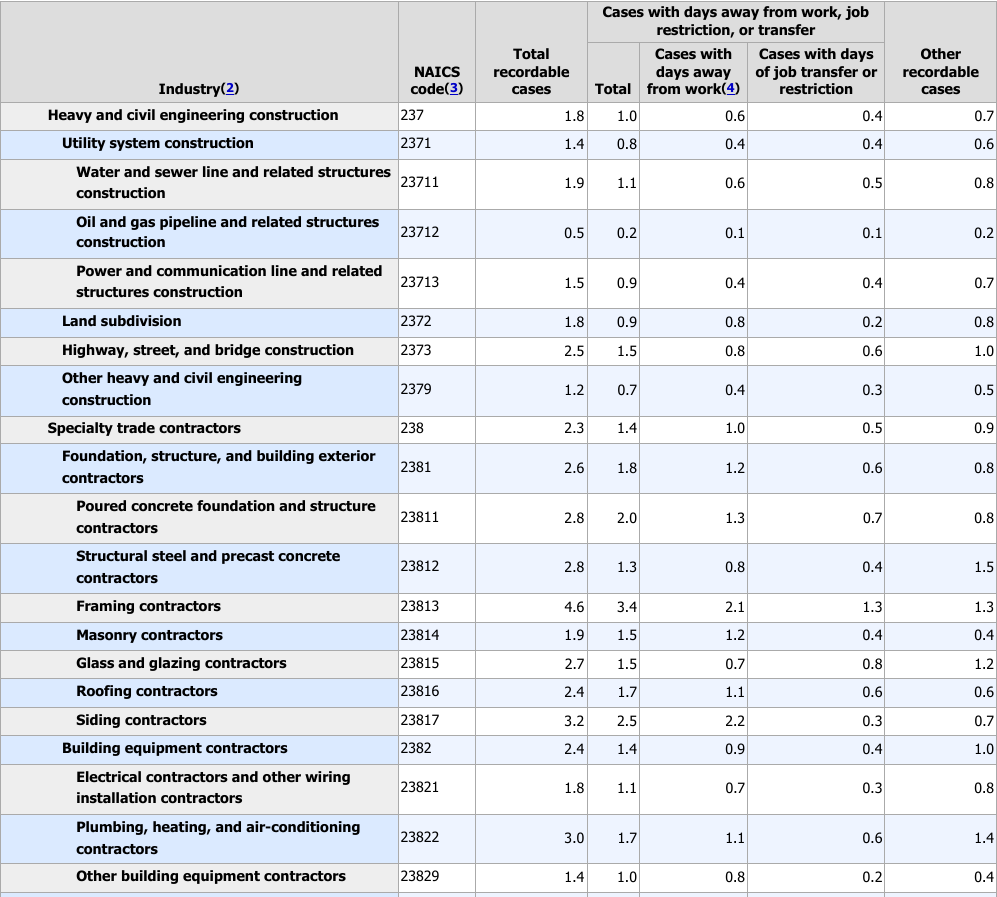
- Electrical contractors had 1.8 recordable injury and illness cases per 100 full-time workers in 2024, against 2.3 for private industry. (BLS Survey of Occupational Injuries and Illnesses, Jan 2026)
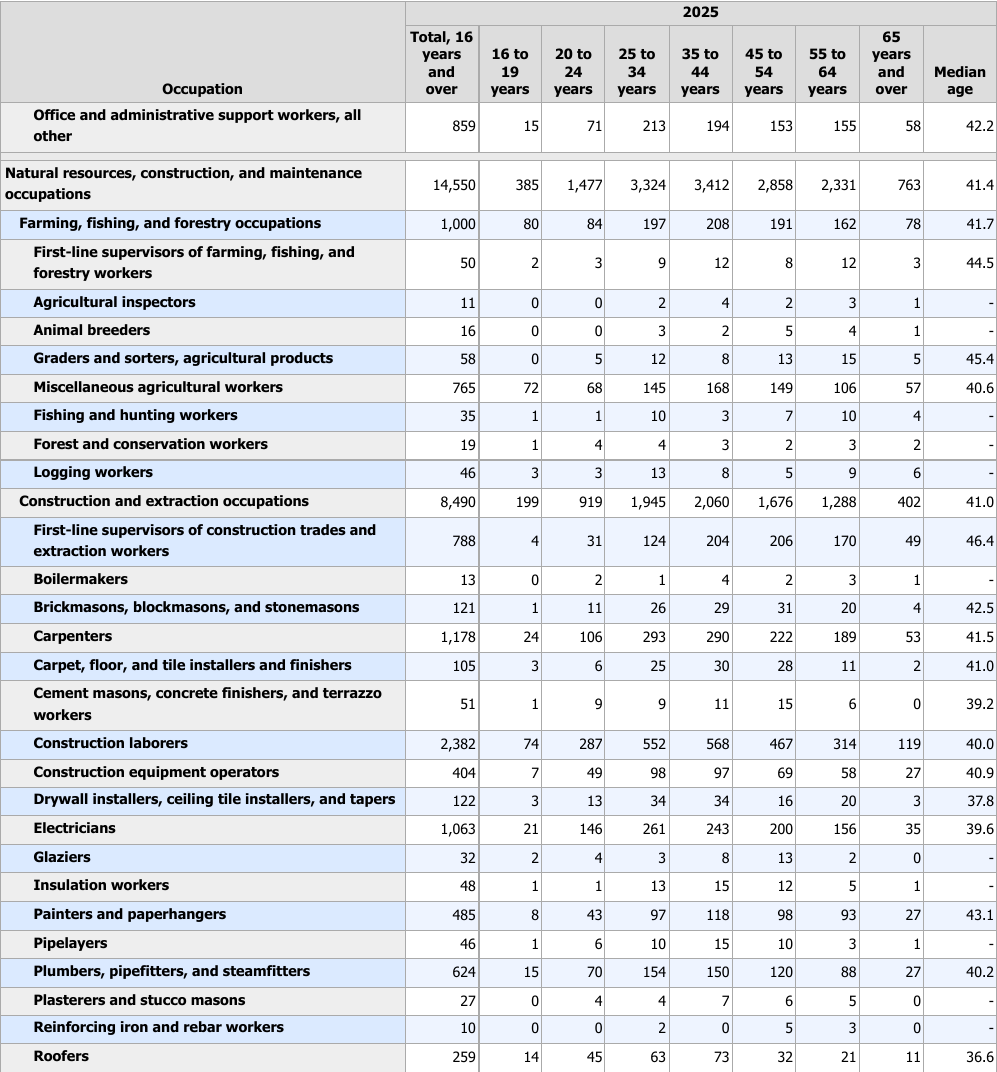
- The median age of electricians was 39.6 in 2025, against 42.1 for all employed people. (BLS Current Population Survey, Jan 2026)
- Among contractors reporting on data-center work, 58 percent said it increased competition for skilled workers. (AGC and NCCER 2026 Workforce Survey, Sep 2026)
How many electricians work in the United States?
No single count exists, because each federal survey draws the line in a different place. Part of the gap is the self-employed.
How do the federal counts differ?
The Occupational Employment and Wage Statistics survey counted 757,220 wage and salary electricians in May 2025. It leaves out the self-employed, which is why it sits below the Occupational Outlook Handbook count. (BLS Occupational Employment and Wage Statistics, May 2025)
- The Current Population Survey counts people by their main job, self-employed included, and put electricians at 1,063,000 in 2025. (BLS Current Population Survey, Jan 2026)
- Self-employed workers made up 7 percent of electrician employment in 2025. (BLS Occupational Outlook Handbook, Aug 2026)
- First-line supervisors of construction trades and extraction workers numbered 812,210, which places electricians third among construction occupations. (BLS Occupational Employment and Wages, May 2026)
- All construction and extraction occupations held 6.4 million jobs, 4.1 percent of national employment. (BLS Occupational Employment and Wages, May 2026)
Which employers hire electricians?
Electrical contractors and other wiring installation contractors accounted for 66 percent of electrician jobs in 2025. (BLS Occupational Outlook Handbook, Aug 2026)
- Manufacturing employed 6 percent of electricians. (BLS Occupational Outlook Handbook, Aug 2026)
- Building equipment contractors alone employed 560,290 electricians in May 2025. (BLS Occupational Employment and Wage Statistics, May 2025)
- Utilities employed 8,980 electricians. (BLS Occupational Employment and Wage Statistics, May 2025)
Which states have the most electricians?
Texas leads with 76,770 electricians in May 2025. (BLS Occupational Employment and Wage Statistics, May 2025)
- California had 73,310. (BLS Occupational Employment and Wage Statistics, May 2025)
- Florida had 49,700. (BLS Occupational Employment and Wage Statistics, May 2025)
- New York had 40,130. (BLS Occupational Employment and Wage Statistics, May 2025)
Has the workforce grown?
Construction electricians grew from 480,400 workers in 2011 to 672,400 in 2023. (CPWR Construction Chart Book, Mar 2025)
- Plumbers in construction numbered 501,800 in 2023, well below electricians. (CPWR Construction Chart Book, Mar 2025)
What does the Bureau of Labor Statistics say electricians earn?
Electricians out-earn the typical American worker, and the spread between the bottom and top of the trade is wide. Pay depends on the employer and the state as much as on skill.
What is the pay range?
The lowest 10 percent of electricians earned less than $42,640 in May 2025. (BLS Occupational Outlook Handbook, Aug 2026)
- The highest 10 percent earned more than $108,510. (BLS Occupational Outlook Handbook, Aug 2026)
- The annual mean wage was $71,490. (BLS Occupational Employment and Wage Statistics, May 2025)
- Full-time wage and salary electricians had median weekly earnings of $1,376 in 2025. (BLS Current Population Survey, Jan 2026)
- The median for all full-time wage and salary workers was $1,204. (BLS Current Population Survey, Jan 2026)
How does pay compare with other trades?
Plumbers, pipefitters and steamfitters had a 2025 median wage of $63,800, close to electricians. (BLS Employment Projections, Aug 2026)
- Carpenters had a median of $60,580. (BLS Employment Projections, Aug 2026)
Which employers pay the most?
Government employers, excluding state and local education and hospitals, had the highest median electrician wage among top industries, $79,820. (BLS Occupational Outlook Handbook, Aug 2026)
- Manufacturing paid a median of $74,550. (BLS Occupational Outlook Handbook, Aug 2026)
- Electrical contractors paid a median of $61,570. (BLS Occupational Outlook Handbook, Aug 2026)
- Utilities paid an annual mean of $102,840. (BLS Occupational Employment and Wage Statistics, May 2025)
- In transmission, distribution and storage, electricians earned about $71,000 a year against $63,000 elsewhere, a 13 percent premium. (U.S. Department of Energy USEER, Aug 2026)
- Electricians in electric power generation had a median wage of $72,000. (U.S. Department of Energy USEER, Aug 2026)
Which states pay the most?
Washington paid electricians an annual mean of $94,470 in May 2025, second only to Oregon. (BLS Occupational Employment and Wage Statistics, May 2025)
- Hawaii paid $92,870. (BLS Occupational Employment and Wage Statistics, May 2025)
- Illinois paid $92,230. (BLS Occupational Employment and Wage Statistics, May 2025)
- Arkansas paid the least among the states and the District of Columbia, $53,470. (BLS Occupational Employment and Wage Statistics, May 2025)
Are employers raising pay?
Fifty-five percent of construction firms raised base pay for hourly craft workers by more than they did a year earlier. (AGC and NCCER 2026 Workforce Survey, Sep 2026)
How fast will electrician jobs grow?
The trade is projected to grow faster than the economy and faster than the construction trades as a group. Many openings come from replacing workers who leave.
What is projected employment in 2035?
BLS projects 896,900 electrician jobs in 2035. (BLS Occupational Outlook Handbook, Aug 2026)
- The projected numeric change from 2025 to 2035 is 75,900 jobs. (BLS Employment Projections, Aug 2026)
- Total employment in all occupations is projected to grow 3.5 percent. (BLS Employment Projections, Aug 2026)
- Construction trades workers as a group are projected to grow 6 percent. (BLS Occupational Outlook Handbook, Aug 2026)
- Plumbers are projected to grow 6.8 percent. (BLS Employment Projections, Aug 2026)
What is the construction demand backdrop?
Construction spending ran at a seasonally adjusted annual rate of $2,203.1 billion in August 2026, 1.7 percent below August 2025. (U.S. Census Bureau Construction Spending, Oct 2026)
- Private nonresidential construction ran at $773.0 billion. (U.S. Census Bureau Construction Spending, Oct 2026)
Who works as an electrician?
The trade is younger than the average workforce, yet its older workers are a growing share in construction data. Women remain a small share.
How old are electricians?
Electricians aged 25 to 34 were the largest group in 2025, at 261,000 workers. (BLS Current Population Survey, Jan 2026)
- Workers aged 55 to 64 numbered 156,000. (BLS Current Population Survey, Jan 2026)
- Workers aged 65 and over numbered 35,000. (BLS Current Population Survey, Jan 2026)
- CPWR counts only electricians who work in construction. It found 16.1 percent of them were 55 or older in 2024. (CPWR Construction Chart Book, Apr 2025)
- That share was 12.6 percent in 2011. (CPWR Construction Chart Book, Apr 2025)
- Plumbers in construction were older, at 21.3 percent aged 55 or older in 2024. (CPWR Construction Chart Book, Apr 2025)
- Carpenters were at 19.6 percent. (CPWR Construction Chart Book, Apr 2025)
- All construction workers were at 21.7 percent. (CPWR Construction Chart Book, Apr 2025)
Who are electricians by sex and ethnicity?
Women were 3.5 percent of employed electricians in 2025. (BLS Current Population Survey, Jan 2026)
- Hispanic or Latino workers were 25.0 percent. (BLS Current Population Survey, Jan 2026)
- Black or African American workers were 9.3 percent. (BLS Current Population Survey, Jan 2026)
How many electricians belong to unions?
From 2011 to 2025 an average of 30.0 percent of construction electricians were union members. (CPWR Construction Chart Book, May 2026)
- Plumbers’ union rate was 20.8 percent in 2025. (CPWR Construction Chart Book, May 2026)
- Carpenters’ union rate was 11.6 percent in 2025. (CPWR Construction Chart Book, May 2026)
How do apprenticeships and state licenses work?
Electricians are made through years of paid training, and each state sets its own license ladder. The records below show how many people sit on each rung.
How long is the training?
Most electricians learn the trade in a 4 or 5 year apprenticeship. (BLS Occupational Outlook Handbook, Aug 2026)
- Apprentices typically receive 2,000 hours of paid on-the-job training for each year of the program. (BLS Occupational Outlook Handbook, Aug 2026)
- Fifty percent of contractors said available candidates lack skills, certificates or licenses. (AGC and NCCER 2026 Workforce Survey, Sep 2026)
- That share was 57 percent a year earlier. (AGC and NCCER 2025 Workforce Survey, Aug 2025)
How big is the apprenticeship system?
Registered apprenticeship counted 593,690 active apprentices in fiscal year 2021. (U.S. Department of Labor Office of Apprenticeship, Sep 2021)
- New apprentices numbered 241,849. (U.S. Department of Labor Office of Apprenticeship, Sep 2021)
- Completers numbered 96,915. (U.S. Department of Labor Office of Apprenticeship, Sep 2021)
- Active programs numbered 27,385. (U.S. Department of Labor Office of Apprenticeship, Sep 2021)
- Carpenter was the second-largest occupation, with 29,800 active apprentices. (U.S. Department of Labor Office of Apprenticeship, Sep 2021)
- Plumber followed, with 21,971. (U.S. Department of Labor Office of Apprenticeship, Sep 2021)
- Sprinkler fitter followed, with 17,595. (U.S. Department of Labor Office of Apprenticeship, Sep 2021)
- Employer-only programs held 291,225 active apprentices in 21,923 programs. (U.S. Department of Labor Office of Apprenticeship, Sep 2021)
- Joint labor-management programs held 256,698 in 4,379 programs. (U.S. Department of Labor Office of Apprenticeship, Sep 2021)
What do state license records show?
State exams cover the National Electrical Code and local rules, and the wire gauge calculator shows the kind of table lookup that code work involves. License types and counting rules differ by state, so the counts below are not comparable across states. Texas listed 18,687 master electrician licenses that had not expired as of October 20, 2026. (Texas Department of Licensing and Regulation, Oct 2026)
- Texas listed 178,463 apprentice electrician records that had not expired. (Texas Department of Licensing and Regulation, Oct 2026)
- Texas listed 12,289 electrical contractor licenses that had not expired. (Texas Department of Licensing and Regulation, Oct 2026)
- Colorado had 7,510 active master electrician licenses. (Colorado Department of Regulatory Agencies, Oct 2026)
- Colorado had 12,700 active journeyman licenses. (Colorado Department of Regulatory Agencies, Oct 2026)
- Colorado had 2,074 active residential wireman licenses. (Colorado Department of Regulatory Agencies, Oct 2026)
- Colorado had 15,449 active electrical apprentice registrations. (Colorado Department of Regulatory Agencies, Oct 2026)
- Colorado had 4,829 active electrical contractor licenses. (Colorado Department of Regulatory Agencies, Oct 2026)
- Oregon had 13,384 active general journeyman electrician licenses. (Oregon Building Codes Division, Oct 2026)
- Oregon had 2,728 active general supervising electrician licenses. (Oregon Building Codes Division, Oct 2026)
- Oregon had 1,418 active electrical contractor licenses. (Oregon Building Codes Division, Oct 2026)
- Washington had 5,565 active electrical contractor licenses. (Washington Department of Labor and Industries, Oct 2026)
- Washington had 2,198 active plumbing contractor licenses. (Washington Department of Labor and Industries, Oct 2026)
Electrical Industry Statistics: How Big Is the Trade?
The electrical contracting trade is a small-business industry. Most establishments are tiny, while a few hundred large ones hold many of the jobs.
How many electrical contractor sites are there?
The Census Bureau counted 83,342 electrical contractor establishments in 2023. (U.S. Census Bureau County Business Patterns, Jun 2025)
- Annual payroll was $77.8 billion. (U.S. Census Bureau County Business Patterns, Jun 2025)
- Establishments with fewer than 5 employees numbered 48,799. (U.S. Census Bureau County Business Patterns, Jun 2025)
- Establishments with 20 to 49 employees numbered 6,300. (U.S. Census Bureau County Business Patterns, Jun 2025)
- Establishments with 100 to 249 employees held 165,753 employees. (U.S. Census Bureau County Business Patterns, Jun 2025)
- The 37 establishments with 1,000 or more employees held 59,075. (U.S. Census Bureau County Business Patterns, Jun 2025)
How many firms and how much revenue?
The Statistics of U.S. Businesses counted 79,611 electrical contractor firms in 2022. (U.S. Census Bureau Statistics of U.S. Businesses, Aug 2025)
- Receipts were $247.6 billion. (U.S. Census Bureau Statistics of U.S. Businesses, Aug 2025)
- Firms with fewer than 5 employees numbered 48,059. (U.S. Census Bureau Statistics of U.S. Businesses, Aug 2025)
- The 250 firms with 500 or more employees held 205,890 jobs. (U.S. Census Bureau Statistics of U.S. Businesses, Aug 2025)
Which states have the most electrical contractor jobs?
California electrical contractors employed 120,017 people in 2023. These counts cover every employee at these firms, not only electricians. (U.S. Census Bureau County Business Patterns, Jun 2025)
- Texas employed 99,988. (U.S. Census Bureau County Business Patterns, Jun 2025)
- Florida employed 70,151. (U.S. Census Bureau County Business Patterns, Jun 2025)
- New York employed 54,886. (U.S. Census Bureau County Business Patterns, Jun 2025)
Is there an electrician shortage?
Contractors say yes, and electricians top their list of crafts they cannot fill. The causes are demand, turnover and candidates who lack skills.
How hard is it to hire?
In the 2025 survey, 77 percent of firms that employ electricians said they were hard to find. (AGC and NCCER 2025 Workforce Survey, Aug 2025)
- Eighty-seven percent of firms had openings for hourly craft workers. (AGC and NCCER 2026 Workforce Survey, Sep 2026)
- Eighty-eight percent of firms with craft openings said those positions were as hard or harder to fill than a year ago. (AGC and NCCER 2026 Workforce Survey, Sep 2026)
- Seventy-three percent of firms expected to add employees in the next 12 months. (AGC and NCCER 2026 Workforce Survey, Sep 2026)
- Forty-two percent reported project delays from their own or their subcontractors’ worker shortages. (AGC and NCCER 2026 Workforce Survey, Sep 2026)
Why are positions hard to fill?
Forty-two percent of firms said new hires fail to show up or quit shortly after starting. (AGC and NCCER 2026 Workforce Survey, Sep 2026)
- Eighty-three percent reported some turnover among new field employees in the first 90 days. (AGC and NCCER 2026 Workforce Survey, Sep 2026)
- Thirty-six percent cited candidates who lack credentials such as a driver’s license, work permit or clean background check. (AGC and NCCER 2026 Workforce Survey, Sep 2026)
- Thirty percent cited candidates who cannot pass a drug test. (AGC and NCCER 2026 Workforce Survey, Sep 2026)
How are data centers pulling on workers?
Twenty-eight percent of firms worked on a data-center project in the past 12 months. (AGC and NCCER 2026 Workforce Survey, Sep 2026)
- Forty-nine percent of firms reporting on data-center effects saw increased wage pressure. (AGC and NCCER 2026 Workforce Survey, Sep 2026)
- Thirty-six percent said data-center work made open positions harder to fill. (AGC and NCCER 2026 Workforce Survey, Sep 2026)
- Thirty percent saw higher turnover. (AGC and NCCER 2026 Workforce Survey, Sep 2026)
- Among transmission, distribution and storage construction employers, 22 percent named electricians and construction workers as a hardest-to-hire group. (U.S. Department of Energy USEER, Aug 2026)
How big is the overall construction labor gap?
ABC estimated the industry must attract 349,000 net new workers in 2026. (Associated Builders and Contractors, Jan 2026)
- ABC estimated 456,000 net new workers will be needed in 2027. (Associated Builders and Contractors, Jan 2026)
How safe is electrician work?
Electrical contractors report injury rates below the private-industry rate, but the daily exposure is high. Protective gear and ladders are part of almost every shift.
How do injury rates compare?
Electrical contractors had 0.7 cases with days away from work per 100 full-time workers in 2024. (BLS Survey of Occupational Injuries and Illnesses, Jan 2026)
- Cases with days away from work, job restriction or transfer numbered 1.1 per 100. (BLS Survey of Occupational Injuries and Illnesses, Jan 2026)
- Plumbing, heating and air-conditioning contractors had 3.0 total recordable cases per 100. (BLS Survey of Occupational Injuries and Illnesses, Jan 2026)
What do electricians face on the job?
Ninety-five percent of electricians said they wear protective equipment such as safety shoes, glasses, gloves and hard hats every day. (O*NET OnLine, Aug 2026)
- Seventy-three percent said they are exposed to hazardous conditions every day. (O*NET OnLine, Aug 2026)
- Sixty-five percent said they are exposed to minor burns, cuts, bites or stings every day. (O*NET OnLine, Aug 2026)
- Sixty-six percent said they climb ladders, scaffolds or poles continually or almost continually. (O*NET OnLine, Aug 2026)
- Eighty-four percent said they bend or twist their bodies continually or almost continually. (O*NET OnLine, Aug 2026)
- Seventy-six percent said being exact or accurate is extremely important. (O*NET OnLine, Aug 2026)
- Heavy components can weigh up to 50 pounds. (BLS Occupational Outlook Handbook, Aug 2026)
The voltage drop calculator covers one of the checks where accuracy counts.
Methodology and Sources
Figures were selected for the US electrician workforce and trade, and each comes from the agency, regulator or research group that produced it. Counts differ by source because of definitions: the Occupational Employment and Wage Statistics survey excludes the self-employed, the Current Population Survey counts people by main job, and CPWR counts electricians who work in construction. Current Population Survey 2025 averages cover 11 months because October 2025 data were not collected during the federal shutdown. State license counts are computed from each state’s open data portal as of October 20, 2026, using records marked active or with an expiration date still ahead, and license types are not equivalent across states. Department of Labor occupation counts are for fiscal year 2021, the year of the page used. BLS Occupational Employment and Wage Statistics values are read from the BLS public data API series linked in each citation. The Department of Energy report date comes from the file’s creation date. The ABC release page blocked automated access, so its figures were read from an earlier fetch of the page. The article is refreshed monthly.
Sources
- BLS Occupational Outlook Handbook: Electricians
- BLS Employment Projections table 1.2
- BLS Current Population Survey table 11b
- BLS Current Population Survey table 11
- BLS Current Population Survey table 39
- BLS Occupational Employment and Wages release, May 2025
- BLS Survey of Occupational Injuries and Illnesses, Table 1
- BLS Occupational Employment and Wage Statistics program
- U.S. Census Bureau County Business Patterns 2023
- U.S. Census Bureau County Business Patterns 2023, state file
- U.S. Census Bureau Statistics of U.S. Businesses 2022
- U.S. Census Bureau Monthly Construction Spending
- AGC and NCCER 2026 Workforce Survey Analysis
- AGC and NCCER 2025 Workforce Survey Analysis
- Associated Builders and Contractors, 2026 workforce shortage release
- U.S. Department of Energy, 2026 U.S. Energy and Employment Report
- O*NET OnLine, Electricians
- U.S. Department of Labor, FY 2021 Data and Statistics
- CPWR Construction Chart Book, union membership data
- CPWR Construction Chart Book, age of workers data
- CPWR Construction Chart Book, employment trends data
- Texas Department of Licensing and Regulation, all licenses
- Colorado Department of Regulatory Agencies, licenses
- Oregon Building Codes Division, active licenses
- Washington Department of Labor and Industries, contractor licenses
Glossary
- BLS: Bureau of Labor Statistics, part of the US Department of Labor.
- OEWS: Occupational Employment and Wage Statistics, the BLS employer survey of jobs and pay.
- CPS: Current Population Survey, the monthly household survey run by the Census Bureau for BLS.
- NAICS: North American Industry Classification System. Code 238210 is electrical contractors and other wiring installation contractors.
- CBP: County Business Patterns, Census Bureau counts of establishments, employees and payroll.
- SUSB: Statistics of U.S. Businesses, Census Bureau counts of firms by size.
- AGC: Associated General Contractors of America.
- NCCER: National Center for Construction Education and Research.
- ABC: Associated Builders and Contractors.
- CPWR: The Center for Construction Research and Training.
- USEER: US Energy and Employment Report, from the Department of Energy.
- TDS: transmission, distribution and storage of energy.
- NEC: National Electrical Code, a trademark of the National Fire Protection Association.
Cite this page
Every figure links to the source that published it. Quote one with a link to this page or to the source.
WireGaugeCalc. "133 Electrician Statistics October 2026." WireGaugeCalc, October 2026. https://www.wiregaugecalc.com/statistics/electrician-statistics/ <a href="https://www.wiregaugecalc.com/statistics/electrician-statistics/">Electrician Statistics</a> (WireGaugeCalc, October 2026)